



Zcash price is vulnerable to an impending correction amid the appearance of a sell signal on the digital asset’s three-day chart that questions the sustainability of the impressive rise past the $1,200 mark.
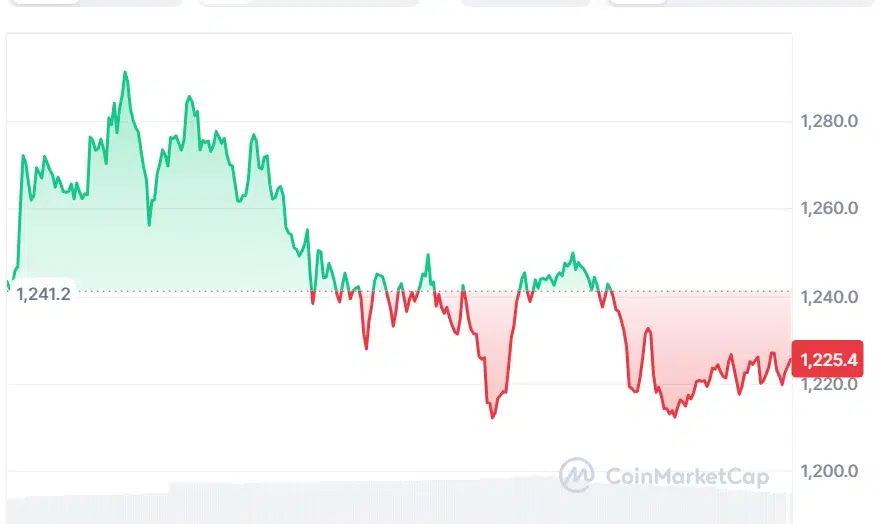
At the time of writing, ZEC is trading at $1,225.43, with a 24-hour trading volume of $4.79 billion and a market capitalization of $20.61 billion. ZEC is down 1.67% over the last 24 hours, showing some cooling after its recent sharp advance.
Zcash Price Signals Potential Reversal
On September 10, 2026, a popular crypto analyst, Ali Martinez, said that the TD Sequential tool has generated a sell signal on the three-day chart of ZEC. As per Martinez, the last time this kind of situation took place back on May 19 saw a correction of 64%.
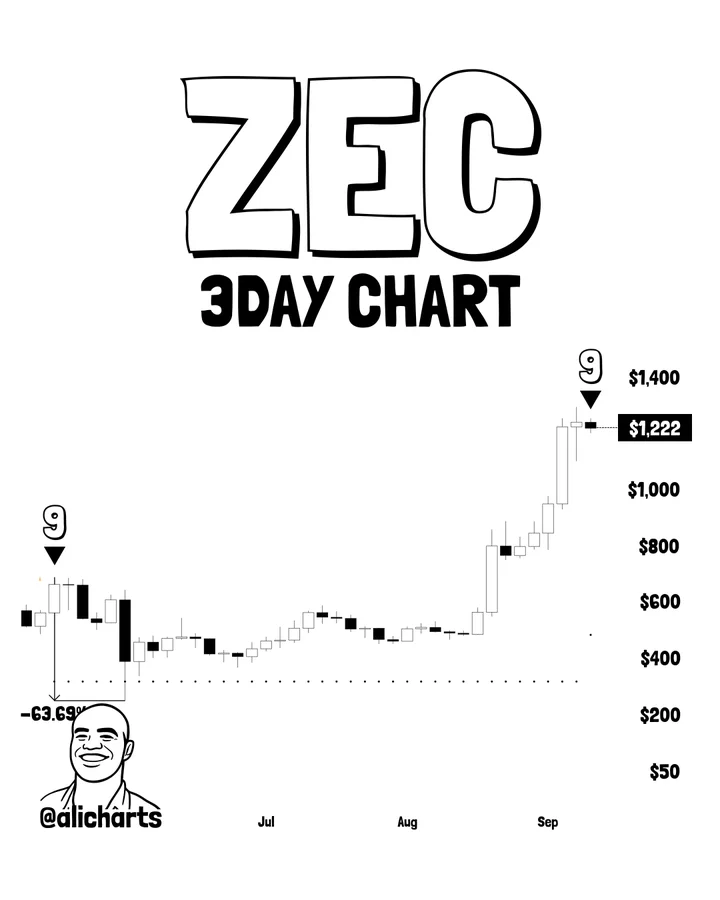
The appearance of the signal does not mean that there is no possibility of the same sort of correction on the current chart, but what can be mentioned is that it is a highly unusual situation coming at such an upsurge period.

Also Read | Nvidia Licensing Deal Draws DOJ Probe Over $17 Billion Groq Deal
Rising Wedge Adds to Correction Concerns
A technical warning also came from another analyst, Crypto With Gopal, who noticed a rising wedge formation on the ZEC/USDT chart.
Based on the technical analysis, ZEC is currently trading at around $1,234 as the distance between the two trend lines of the wedge keeps narrowing after the latest price rally. The $1,300 area has become an important level of resistance.
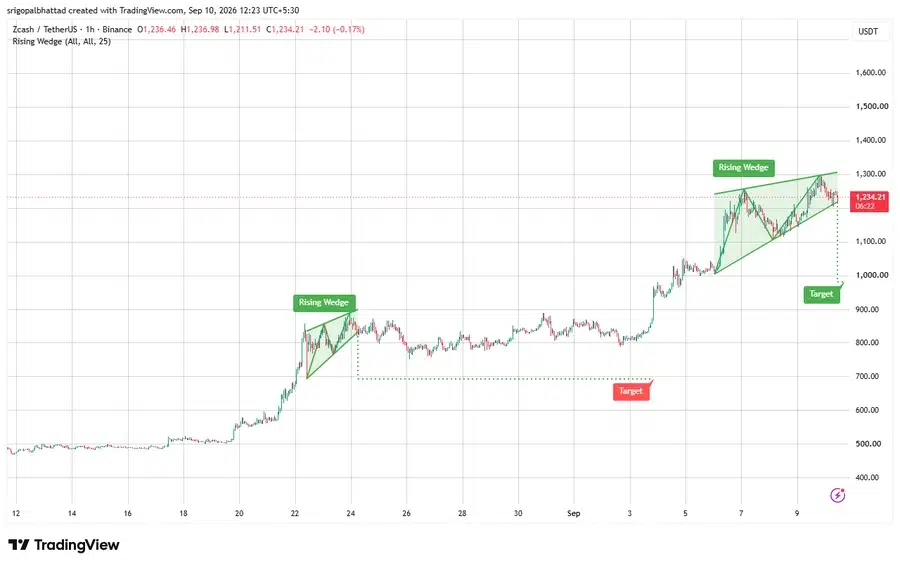
Any break above $1,300 could undermine the bearish implications of the pattern and pave the way for further gains. Alternatively, any breakout below the lower support line could indicate that the recent uptrend is weakening and may lead to further downside.
It forms a critical struggle in the short term between a continuation and a corrective phase. The bulls will need to make sure that there is sufficient momentum behind the upside.
Zcash Price Signals Strong Bullish Momentum
Zcash’s Bollinger Bands show the price near the top at $1,272.0715 while the middle band is seen at $943.0335. The bottom band is located at $613.9955, with a wide distance. As ZEC continues its strong upward price action, the BB setup is seen to be bullish, as the price is far from the middle band.
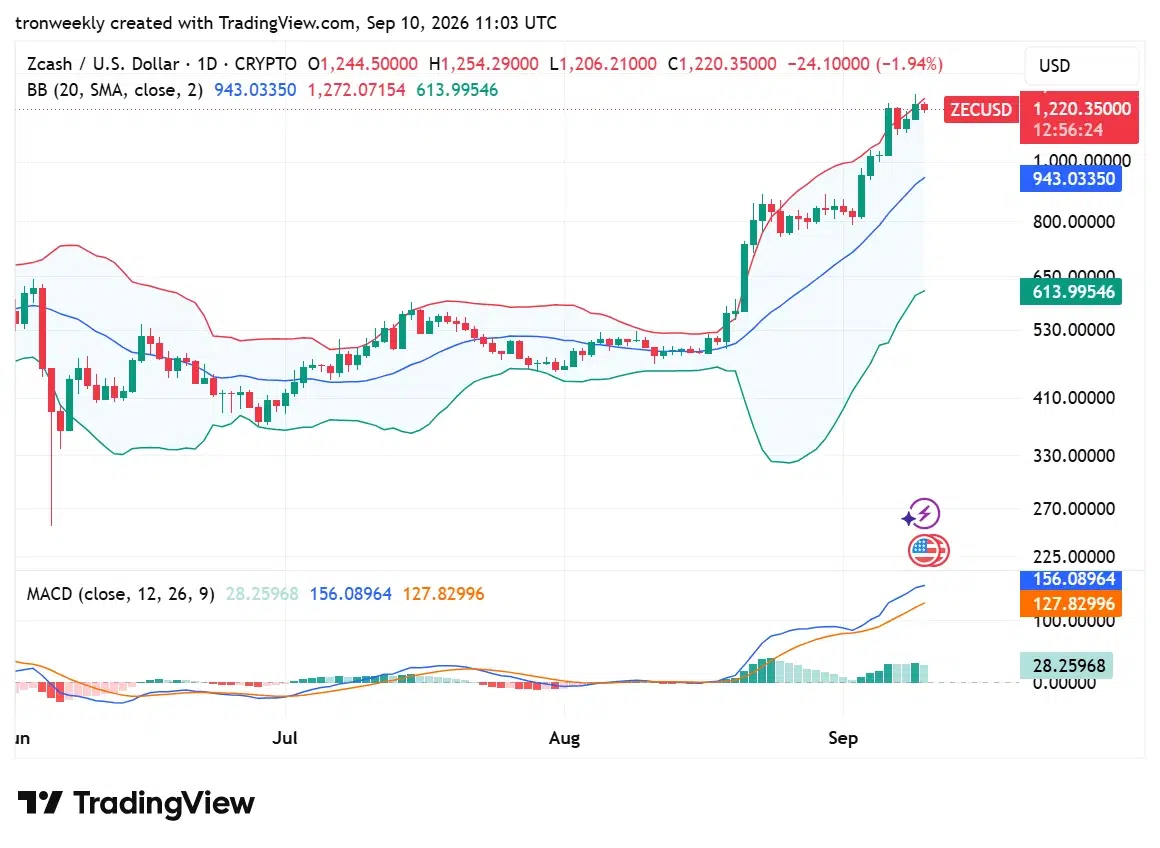
The MACD is also pointing to very strong buying momentum, where the MACD line is seen at 156.0896 while the signal line is seen at 127.8300. The histogram is also seen to be at 28.2597, and it indicates that the buying momentum is still present.
Why the Zcash Setup Matters
The possibility of a correction is significant since ZEC has progressed significantly ahead of most major cryptocurrencies over the past months.
The pullback will not signify the reversal of the general uptrend. It may simply provide an opportunity for the formation of a fresh level of support following the fast run above the $1,000 mark.
Another reason for paying attention to the ongoing price dynamics is the recent news related to the ETF. Grayscale’s ZCSH has introduced a regulated U.S.-based channel for ZEC investments, and its increased holdings have led to less ZEC on the open market.
On the other hand, Zcash’s network activity has developed in parallel to the rally. The latest network statistics indicate growth in shielded activity, and the project is making plans for upcoming developments such as quantum-proofing Zcash towards late 2026.
Such moves may ensure the sustainability of interest in Zcash despite a short-term correction in the token’s price.
What Happens Next for Zcash Price?
It appears that the $1,300 mark will be an important point of interest for some time ahead. The break above that range would make the bullish case stronger and confirm that ZEC is prepared to go further up.
The failure to break out, coupled with a drop below the rising wedge support, would mean that there is a higher possibility of a deeper pullback.
Another psychological mark is $1,000. ZEC broke through that mark when it went up in its September rally, and CoinDesk mentioned the short liquidations that occurred along with the breakout.
To summarize, what stands out for now is the fact that Zcash still has a very bullish long-term picture, but the short-term risks have been on the rise. In particular, the sell signal generated by the TD Sequential indicator, combined with the rising wedge formation, indicates the potential for a pullback, while the MACD, moving averages, and ETF interest keep signaling an overall bullish scenario.
The decisive factor for the upcoming price action would be the ability of ZEC to either breach above $1,300 or lose its upward trendline support below it.
Also Read | Ripple Legal Chief Presses Senate Ahead of CLARITY Act Vote
This article contains market analysis and price predictions. These are not guarantees. Crypto markets are volatile. Always DYOR. Not financial advice.



Be the first to comment