



The Shiba Inu (SHIB) market has developed the conditions for a explosive price release: according to the TradingView chart, the coin is trapped at the apex of a large symmetrical triangle, while a parallel audit of blockchain records on Etherscan points to an extreme concentration of capital.
You Might Also Like


Right now, 94.68% of the circulating supply is controlled by a closed pool of large holders, pushing the coin toward an imminent breakout from the technical pattern.
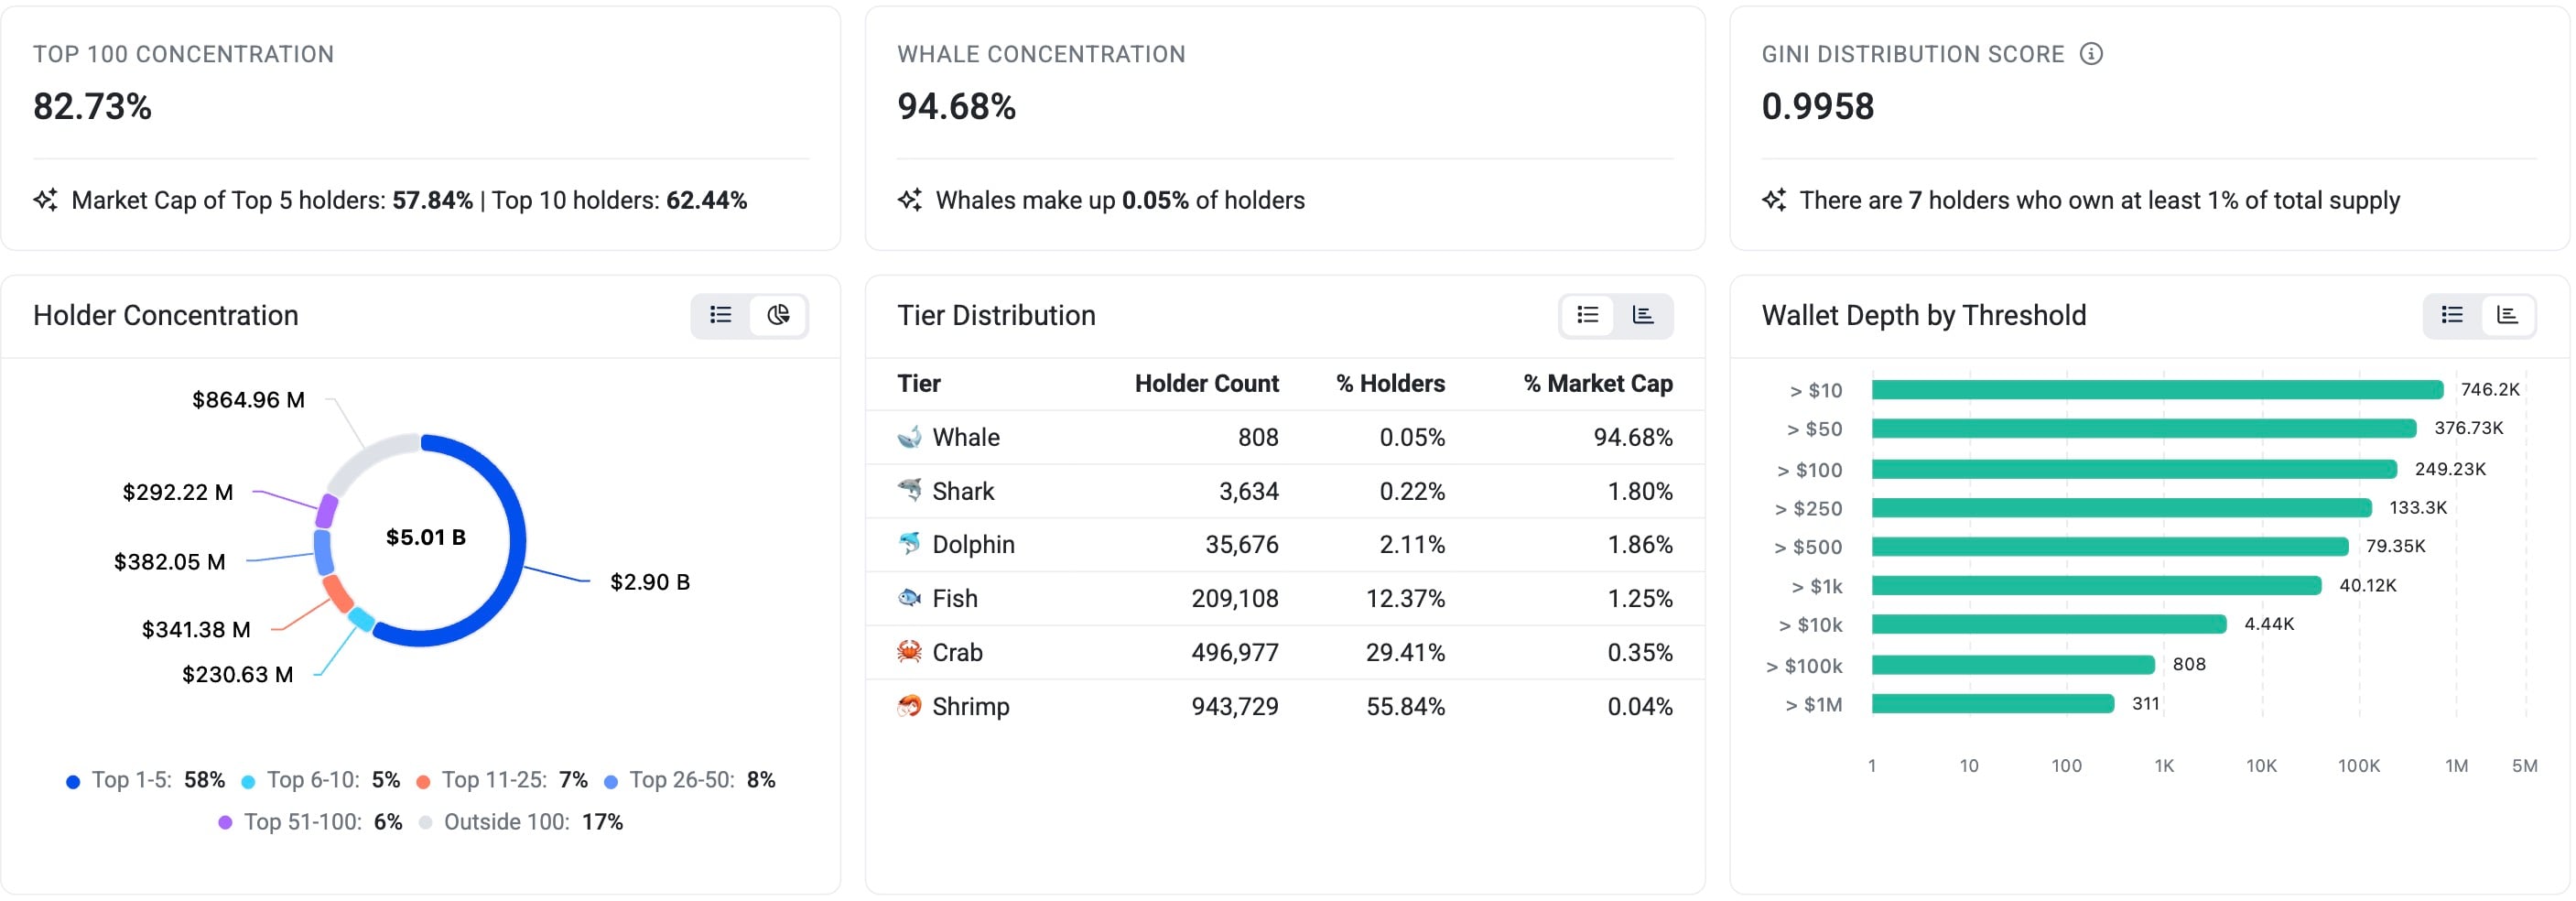
All power in the hands of 808 wallets: How the SHIB market is structured
According to Ethereum’s Token Analytics module, nearly the entire available Shiba Inu token supply is locked across 808 addresses, representing a negligible 0.05% of all investors. While the top 100 wallets hold 82.73% of the supply, the million-strong army of retail investors controls just 0.04% of the tokens.
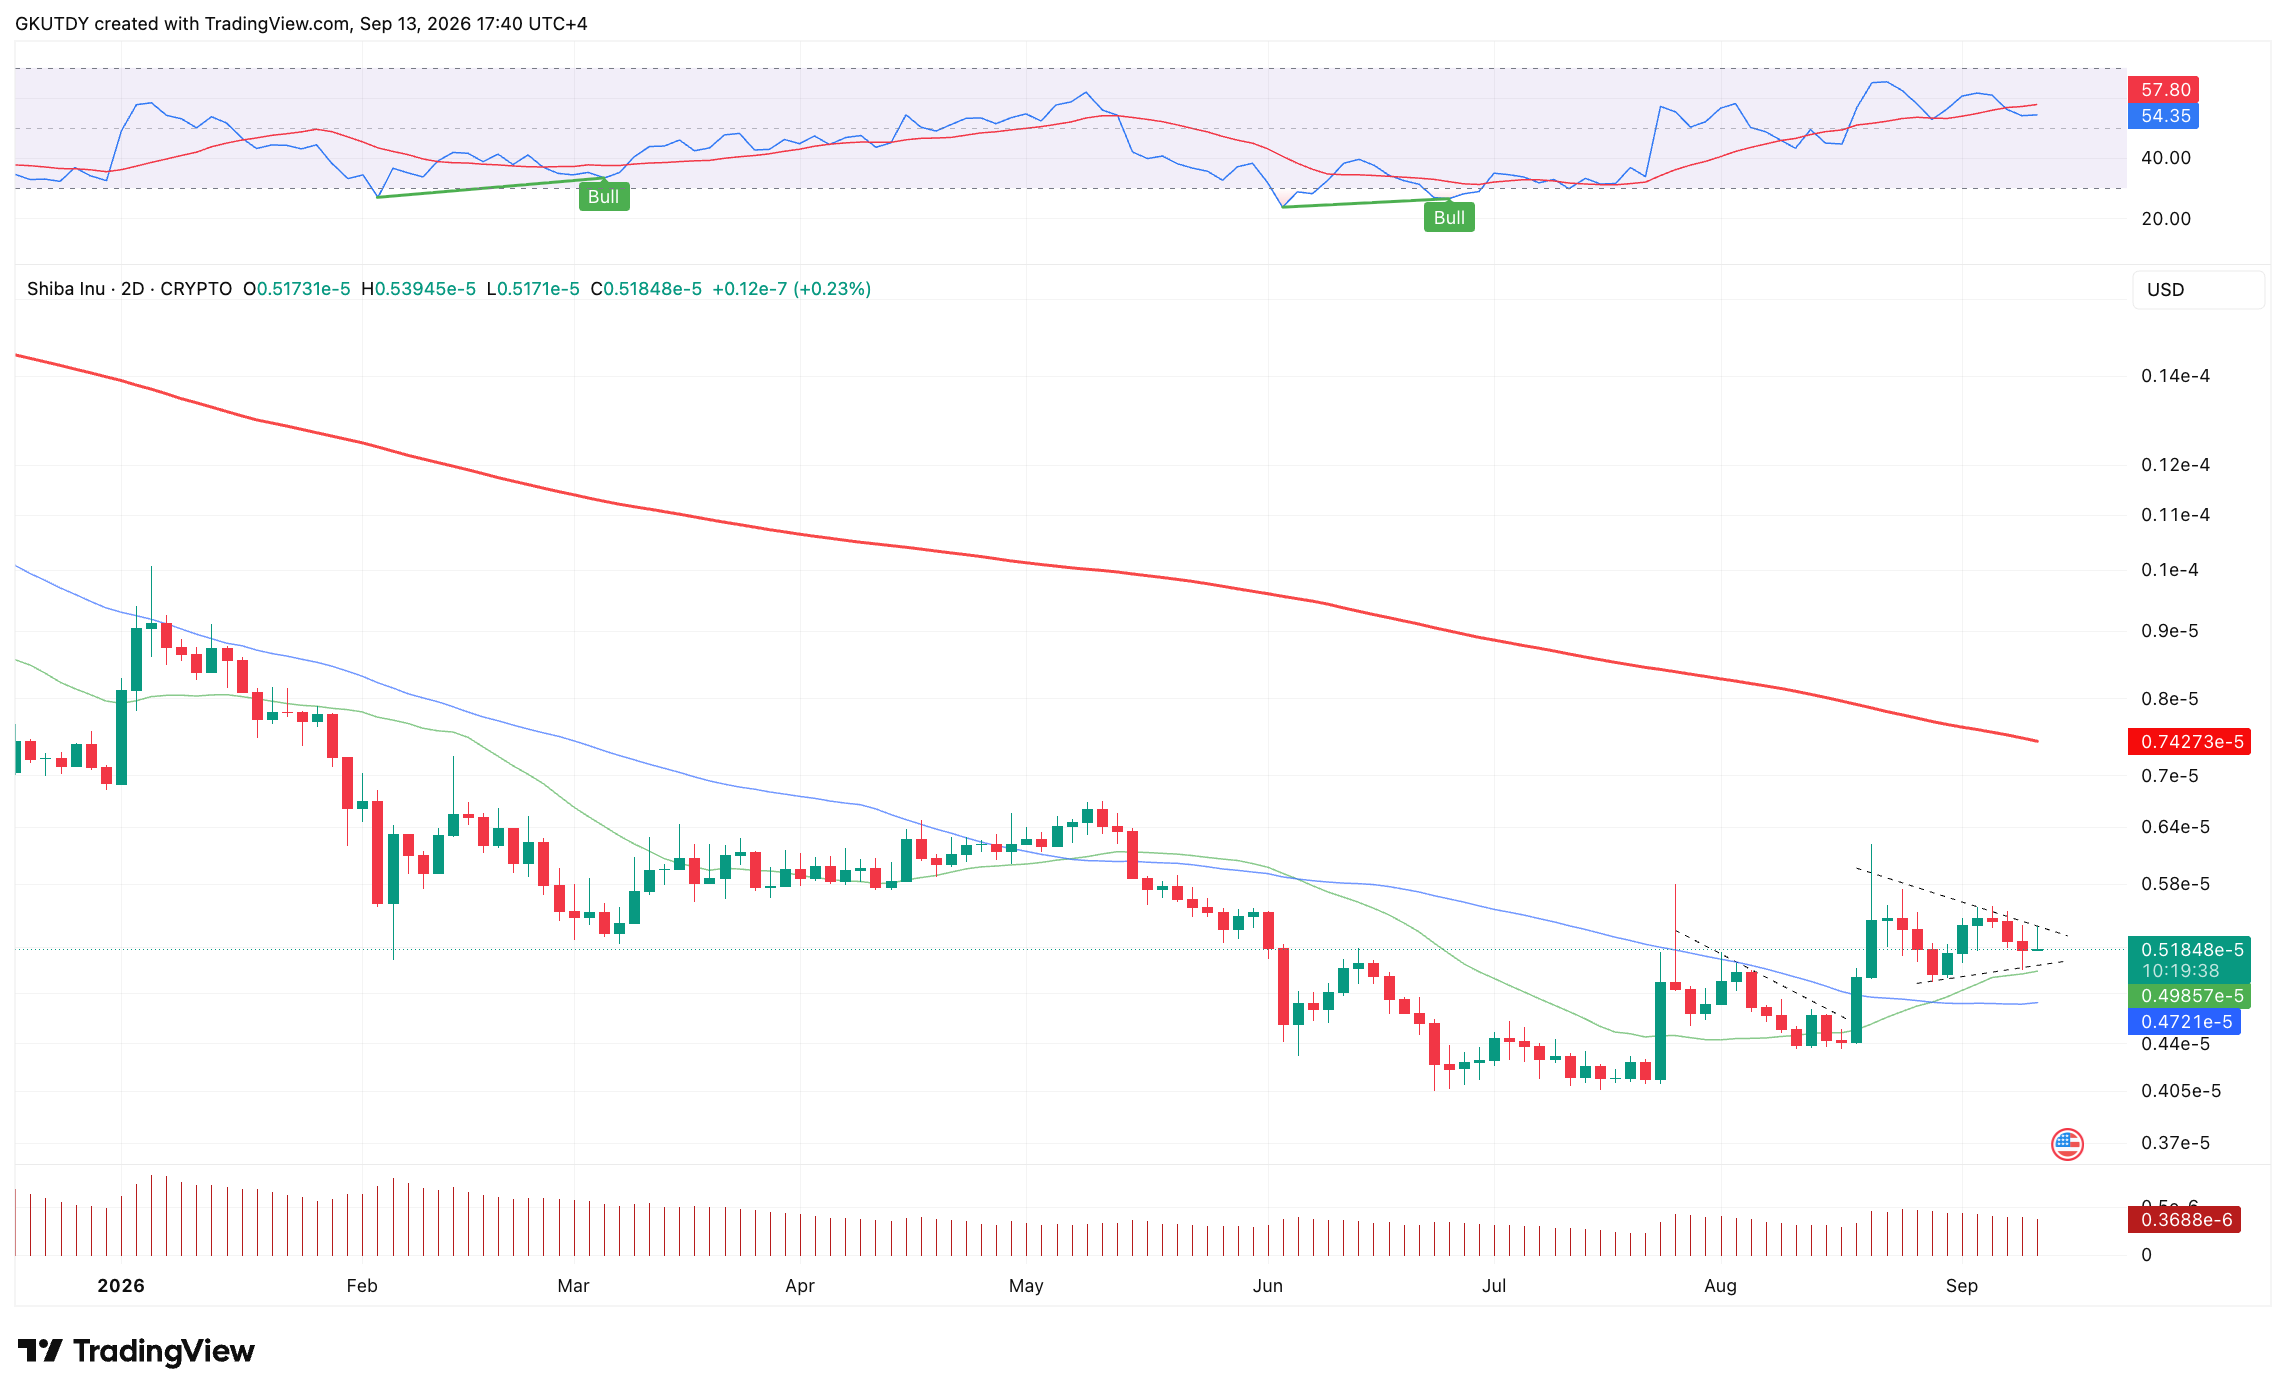
Traders are currently focused on two key triggers at the pattern’s boundaries that will determine the direction of the next move:
- Bullish momentum: A daily candle close above the $0.00000540 resistance level would open a direct path toward $0.000006 and $0.000008.
- Bearish breakout: Losing the psychological support at $0.00000500 would prompt whales to cut their losses and immediately send SHIB to new local lows.
Against this backdrop, SHIB’s current on-chain market capitalization stands at $5.19 billion. However, because of the overwhelming dominance of large holders, the price trajectory depends entirely on the trading decisions of several hundred players capable of directing the trend regardless of broader market demand.
You Might Also Like

Price compression within the large-scale pattern has already reached its limit. On the daily TradingView chart, the resistance trendline from the August highs of $0.00000600 and the long-term support line have converged at a critical point, holding SHIB near $0.00000520 after a 1.71% decline over the past 24 hours.
Meanwhile, the Relative Strength Index (RSI) remains at a neutral 54.54, indicating a temporary balance of power immediately before the asset exits a corridor that leaves no room for further consolidation.
With liquidity concentrated among such a narrow group of addresses, the coming price impulse following a breakout from the triangle will be directional and swift.



Be the first to comment