



Ethereum price has fallen under sell-off pressure after retracing from its latest peaks, but market analysts remain optimistic about a further increase in ETH price as long as it trades above a particular breakout area.
At the time of writing, ETH is trading at $2,478.34, with a 24-hour trading volume of $15.22 billion and a market capitalization of $301.50 billion. Ethereum’s price has declined 2.23% over the last 24 hours, reflecting the short-term pressure across the market.
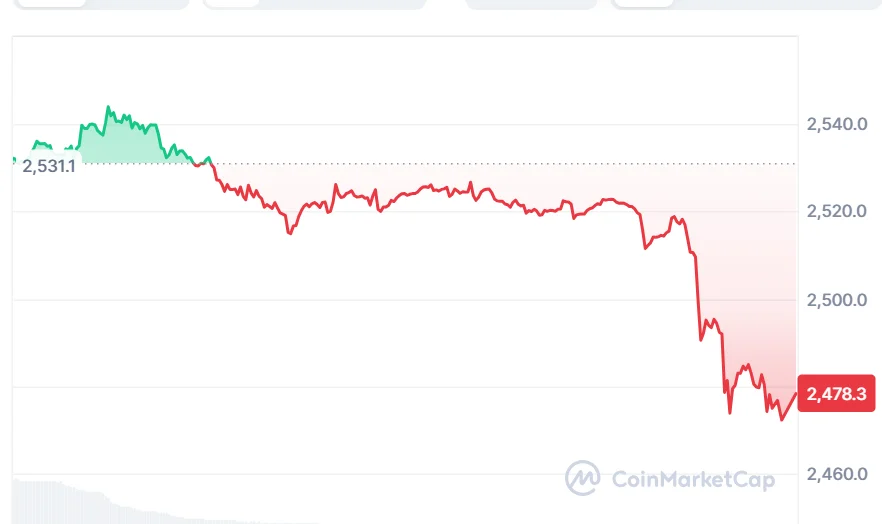
Even though the drop has occurred, the technical picture remains relevant due to the fact that the ETH price is currently trading above the $2,300-$2,400 area, which previously served as a significant resistance level.
Also Read | Solana Price Targets $147 Breakout as Network Activity Hits New Highs

Ethereum Breaks Above Major Resistance
There was one key difference pointed out by the crypto analyst Wealthmanager on September 13.
According to Wealthmanager, Bitcoin is still having trouble rising above the higher time-frame resistance level of $82,000-$83,000. On the other hand, Ethereum has risen above its higher time-frame resistance levels of $2,300-$2,400.
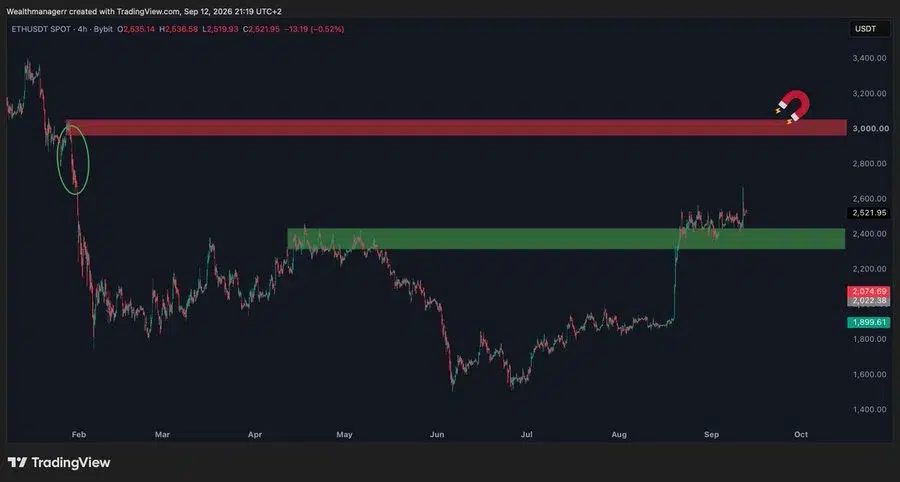
This will be critical to the larger cryptocurrency market as well. In case ETH sustains above the former resistance level, it may turn out to be the support that propels the next upward move.
According to Wealthmanager, Ethereum is seen hitting $3,000 before reverting to the $2,300 range. However, this is just an opinion of the market and not a certainty.
Furthermore, a consistent trend toward $3,000 would constitute another major psychological and technical barrier to be broken by Ethereum. A breach of this barrier might contribute to the overall narrative of the market recovering.
Ethereum Price Pullback May Be Part of the Reset
Another analyst, Daan Crypto Trades, provided an alternate but similar insight about the recent action in ETH.
The second analyst mentioned that ETH has retraced towards the breakout zone after the recent pump in price. He added that the prior move had a lot of activity in perpetual futures, and open interest had been stripped off.
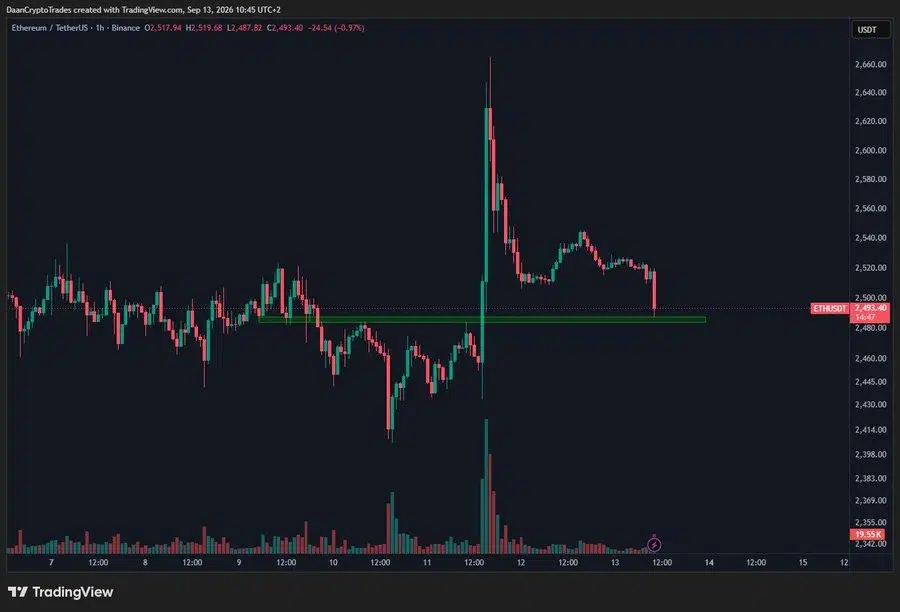
This is important because the reduction in leverage may lead to a release of some pressure from the crowded trades.
When a strong crypto move has substantial backing from derivative positions, the increasing open interest might intensify the moves both to the upside and to the downside. Thus, the decrease in open interest would assist in restoring the market structure.
Regarding Ethereum, the present consolidation might be regarded as a trial as to whether the breakout is capable of holding following the removal of some of the previous gains’ leverage.
If the bulls manage to defend the breakout area, then there is a good basis for making another push up. Otherwise, ETH may fall into a more extended consolidation period.
Ethereum Price Tests Support as Momentum Weakens
Ethereum is currently trading around the mid Bollinger Band at $2,470.30400, whereas the upper band is positioned at $2,543.74259. The lower band is set at $2,396.86541, and with this, ETH continues to trade in a wide range following the recent rise in price. The fact that the price is currently trading around the mid-band means that the current trend is fairly balanced.
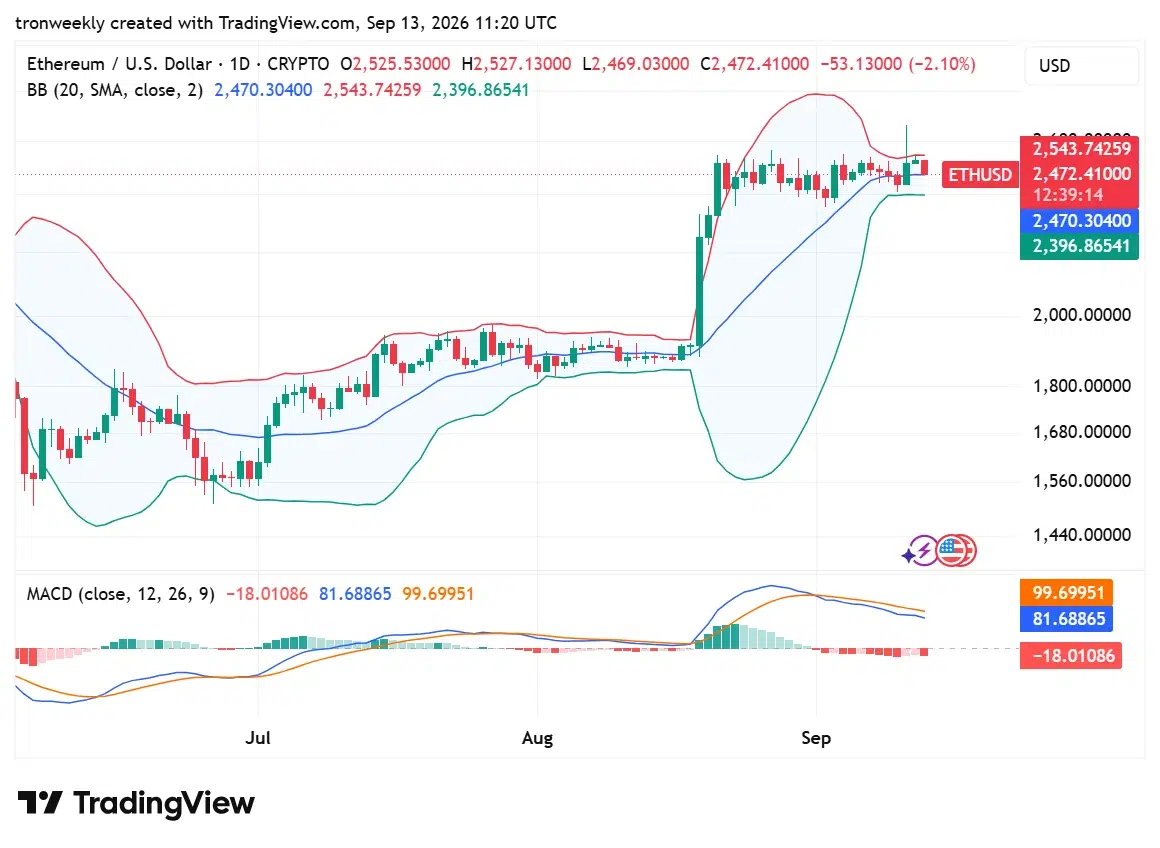
MACD indicator shows that the MACD line is placed at 81.68865 and below the signal line, which is at 99.69951. Meanwhile, the histogram is positioned at -18.01086. Such a configuration implies that ETH may come under some pressure until MACD momentum improves.
Why the $2,300–$2,400 Zone Matters
The range of $2,300 to $2,400 has now emerged as one of the key areas for the Ethereum cryptocurrency since this is the area which ETH has just breached upwards.
Conversion of a former resistance level to a support level is one of the features associated with bull markets. For Ethereum, it will show that the sellers are not putting pressure on the cryptocurrency if it manages to hold above this range.
If this range gets breached, however, it will show that there was not sufficient momentum behind the breakout from it, and there are chances that ETH may revisit the lower support areas again.
For this reason, the upcoming sessions can be pivotal for distinguishing between retracement and correction.
What Happens Next for Ethereum Price?
For now, the question is about ETH’s ability to protect the $2,400 region and to go back to the $2,500 level.
ETH’s rise above $2,543, just below its current Bollinger Band, will mean that buyers are getting interested again, which means that the $3,000 threshold noted by Wealthmanager will come into focus.
On the flip side, $2,400 is the next major level to monitor, along with the $2,300-$2,400 breakout area.
MACD will also play an important role. Positive momentum and a bullish cross can help ETH resume its growth, while the opposite situation may push the coin to stay in consolidation or retrace further.
Also Read | Ethereum Price Eyes $3,000 Breakout as RWA Market Dominance Strengthens
This article contains market analysis and price predictions. These are not guarantees. Crypto markets are volatile. Always DYOR. Not financial advice.



Be the first to comment