



Solana (SOL) registered an uptick of 2.49% in the last 24 hours to hit $99.03 on the charts. Its gains were slightly more substantial than the broader market’s more modest recovery.
The move came on the back of traders responding positively to Solana’s recent network upgrades, while Layer 1 tokens also witnessed renewed interest.
Despite these encouraging factors though, SOL remained below $100. Can bulls push the recovery further?
Solana’s daily chart points to consolidation
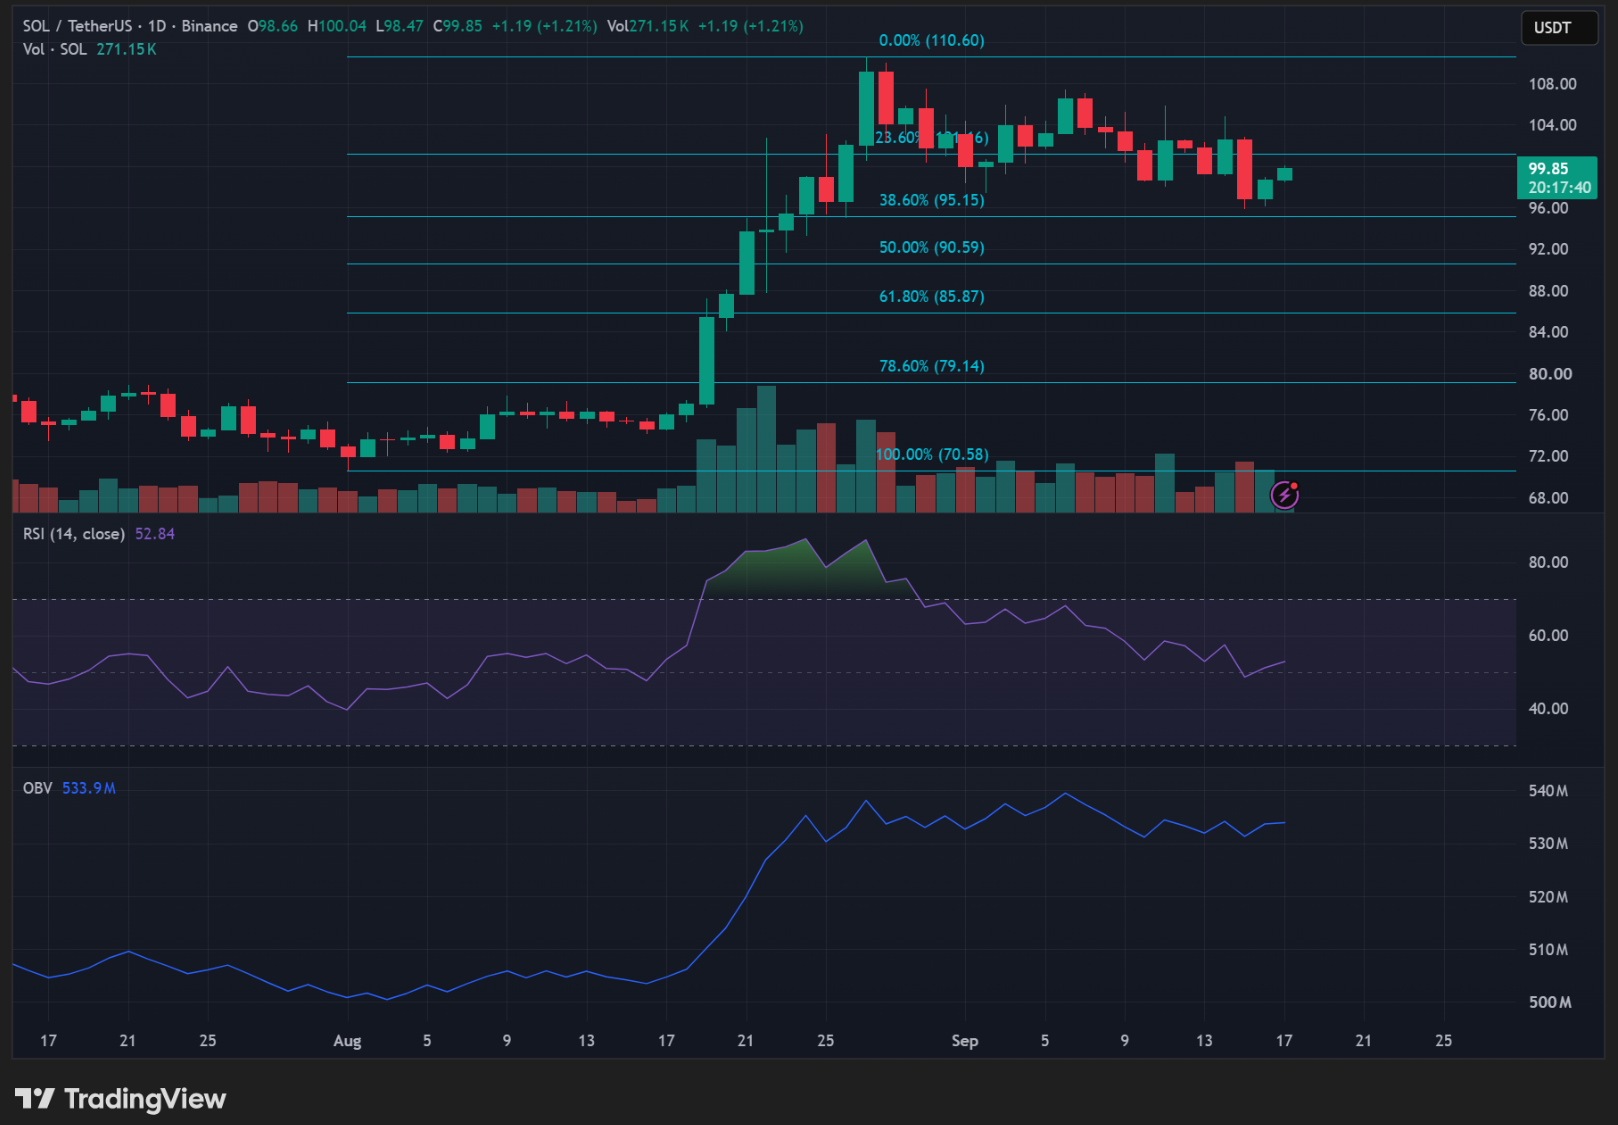
SOL has been trending slightly lower since its recent bullish rally; however, the pullback has remained controlled as the bulls have continued to defend the 38.6% Fibonacci retracement at $95.15.

This level was broken in late August and it has since held as an important part of the token’s broader price structure. Additionally, the price seemed to be approaching the 23.6% Fibonacci level at $101.16 at press time. However, reclaiming this zone could prove difficult without stronger momentum.
Technical indicators also supported the likelihood of consolidation. The RSI sat just above neutral at 52, while the OBV had started to flatten. With momentum limited, it could leave room for SOL to consolidate and hold its ground rather than immediately extend its recovery.
For now, the 38.6% Fibonacci level remains important to the broader structure. As long as SOL continues to hold above it, its recovery will remain intact. Even if the price spends more time moving sideways.
SOL’s 4-hour chart gives bulls a chance despite weak momentum
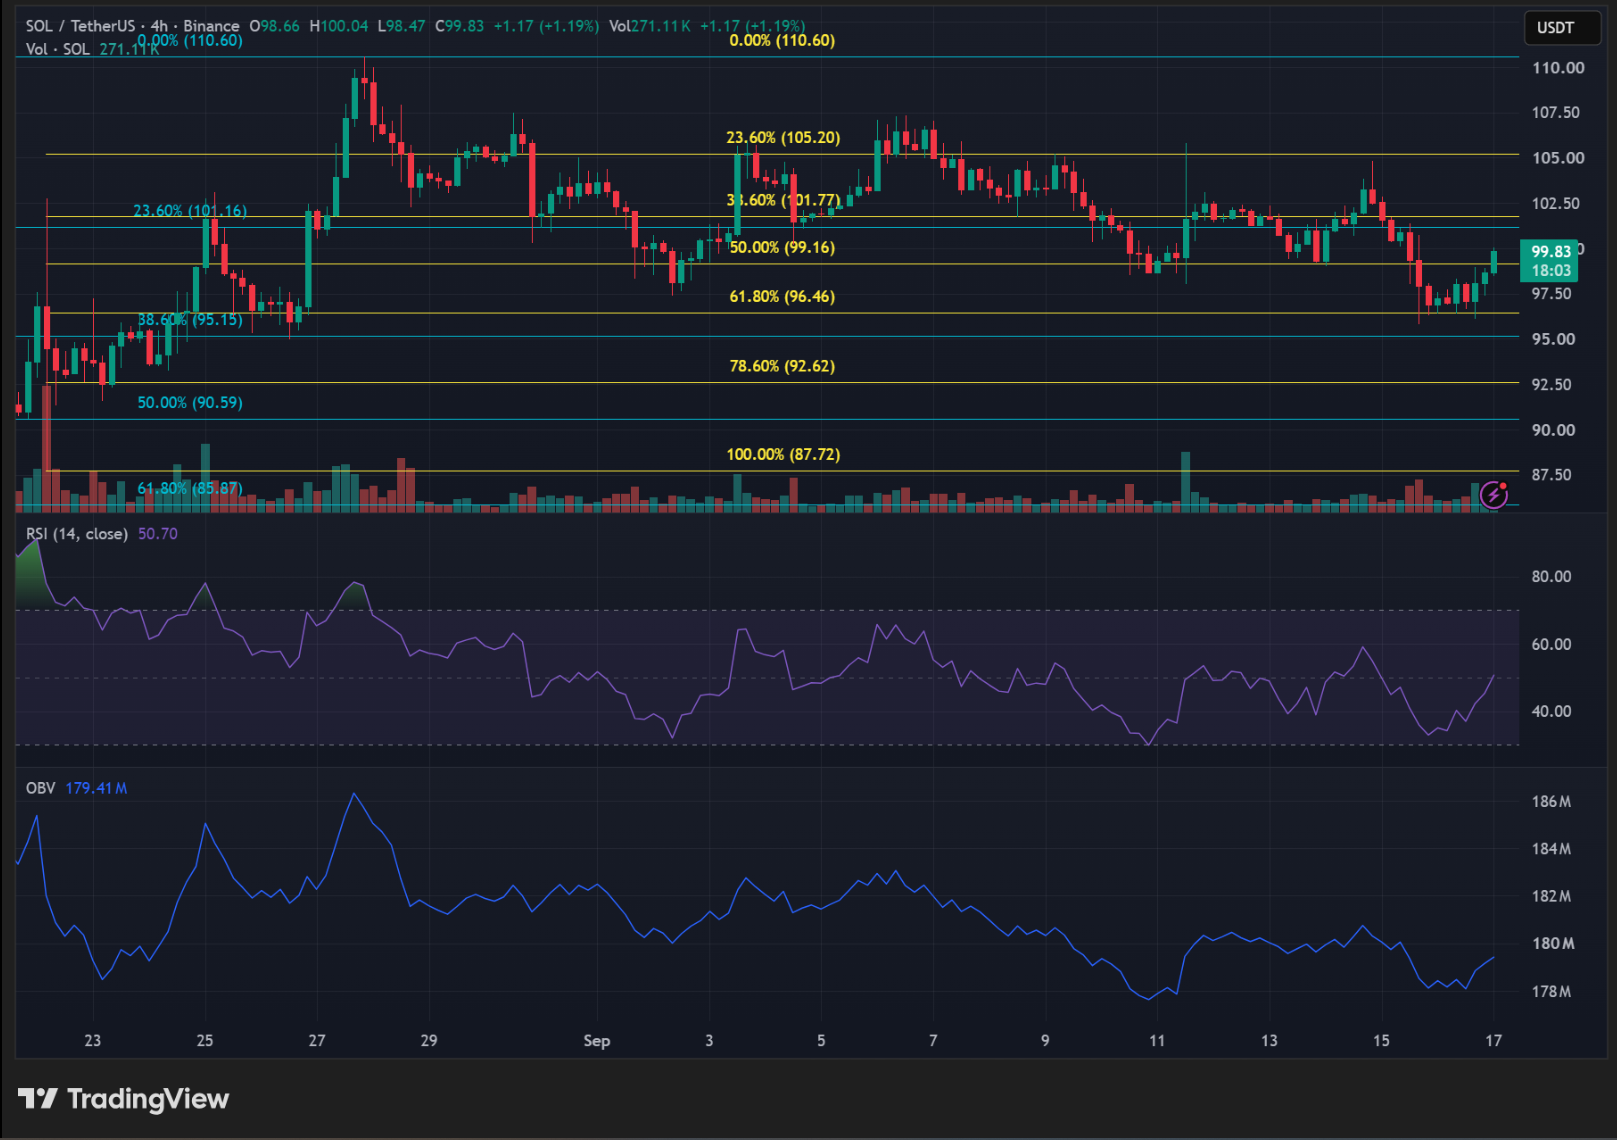
The 4-hour chart offered bulls a little more encouragement. SOL fell over the past 48 hours, eventually hitting the 61.8% Fibonacci retracement at $94.46. The level sits within the golden pocket though and attracted buyers, helping SOL recover.
In fact, SOL has since broken above the 50% Fibonacci level at $99.16, putting this level in focus. This recovery wasn’t supported by convincing momentum though. The 4-hour RSI was at 51, while the OBV had just started to tick higher.
A sustained hold above $99.16 could give bulls room to extend the recovery, particularly if buying volume picks up. If the broader downtrend resumes and SOL falls back below this level, $94.46 will be the next key test.
The 61.8% Fib is particularly important because SOL is yet to break it since its recent bullish rally. As long as the bulls are able to successfully defend this level, the short-term recovery structure will be preserved.
Even if a move back towards $94.46 happens, it wouldn’t completely damage the broader daily setup. SOL would still be above the daily 50% Fibonacci retracement, giving it some leeway for the pullback to remain part of a wider consolidation rather than a complete reversal.
Final Summary
- SOL’s 4-hour 50% Fibonacci level at $99.16 is the immediate test of whether bulls can sustain recovery.
- If the $95-$100 demand zone is held, the token’s broader daily structure will remain intact.






Be the first to comment