



Solana price has shown early signals that could possibly indicate the start of a turnaround in its performance due to the appearance of an important technical setup on its weekly chart. This is coming amid the development of more activity in tokenized stocks on the Solana blockchain network.
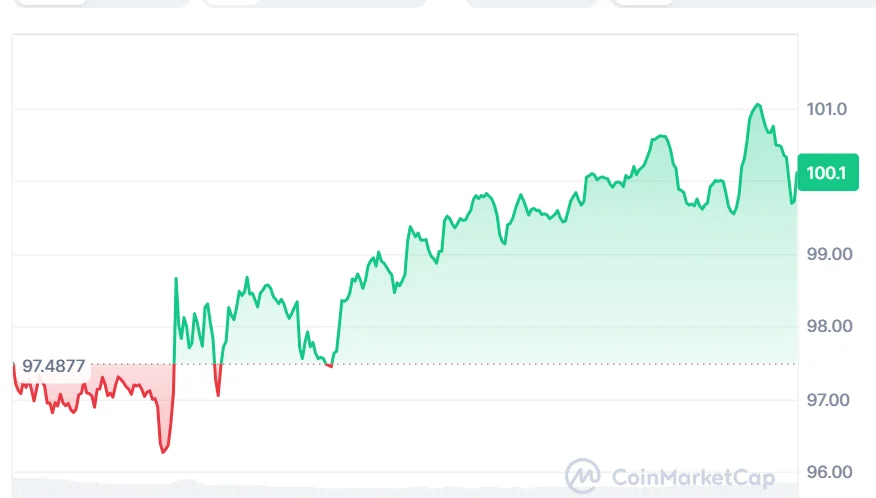
At the time of writing, SOL is trading at $100.14, with a 24-hour trading volume of about $6.27 billion and a market capitalization near $59 billion. SOL has gained roughly 2.88% over the last 24 hours, according to CoinMarketCap.
Also Read | Avalanche Gets New Privacy Layer for Onchain Finance
Solana Price Faces Key Technical Test
Crypto analyst Trader Tardigrade drew attention to a weekly chart of Solana on September 17, which revealed the approaching crossover of two lines of simple moving averages, the 100-period and the 150-period ones, following the reversal of SOL from a falling trend into forming a base.

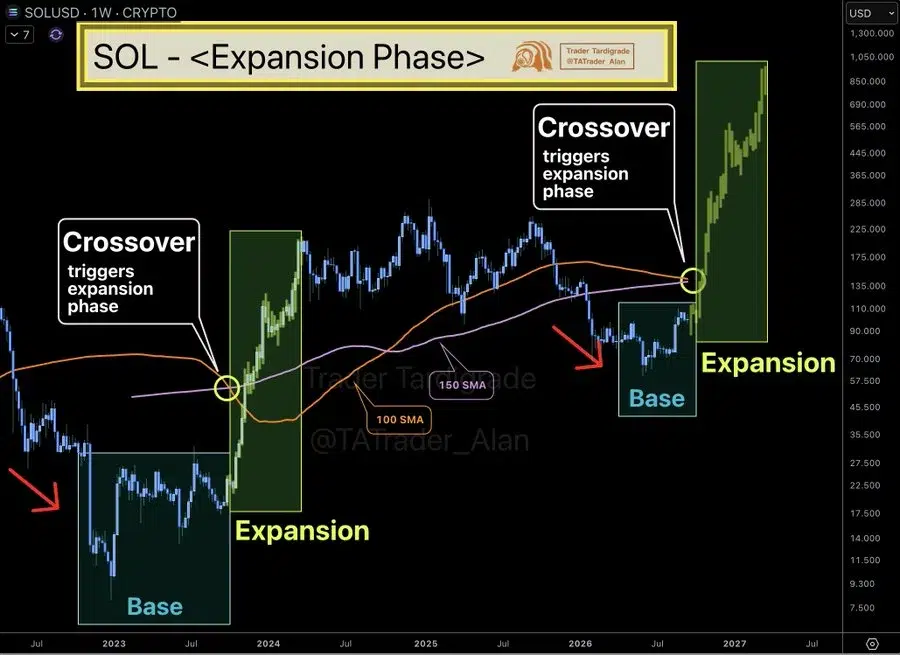
As stated by Trader Tardigrade, at present, there are three main components in this formation: a price base, the meeting of the two moving averages, and the potential crossover, which may mark the start of a bigger expansion period.
Tardigrade Trader referred to past examples of when a similar pattern of a moving average had preceded a rise in the price of SOL. Therefore, the trader recommended that this current cross is likely to be a very significant technical event for the Solana price.
He made even more detailed predictions about how high SOL might reach, setting a target of $1,000 per SOL. This is a technical target set by the trader, not a market target yet.
In the meantime, the more urgent question remains whether SOL will be able to sustain its rally above the $100 level and gain sufficient strength to test higher levels of resistance.
SOL Momentum Shows Signs of Cooling
Solana is currently trading in the middle Bollinger Band at 101.78890. The upper Bollinger Band is currently placed at 106.48874, while the lower Bollinger Band is currently at 97.08906. Price action is currently trading below the upper Bollinger Band, indicating that the uptrend is losing some pace. The level of 97.08906 on the lower Bollinger Band is significant if selling pressure rises.
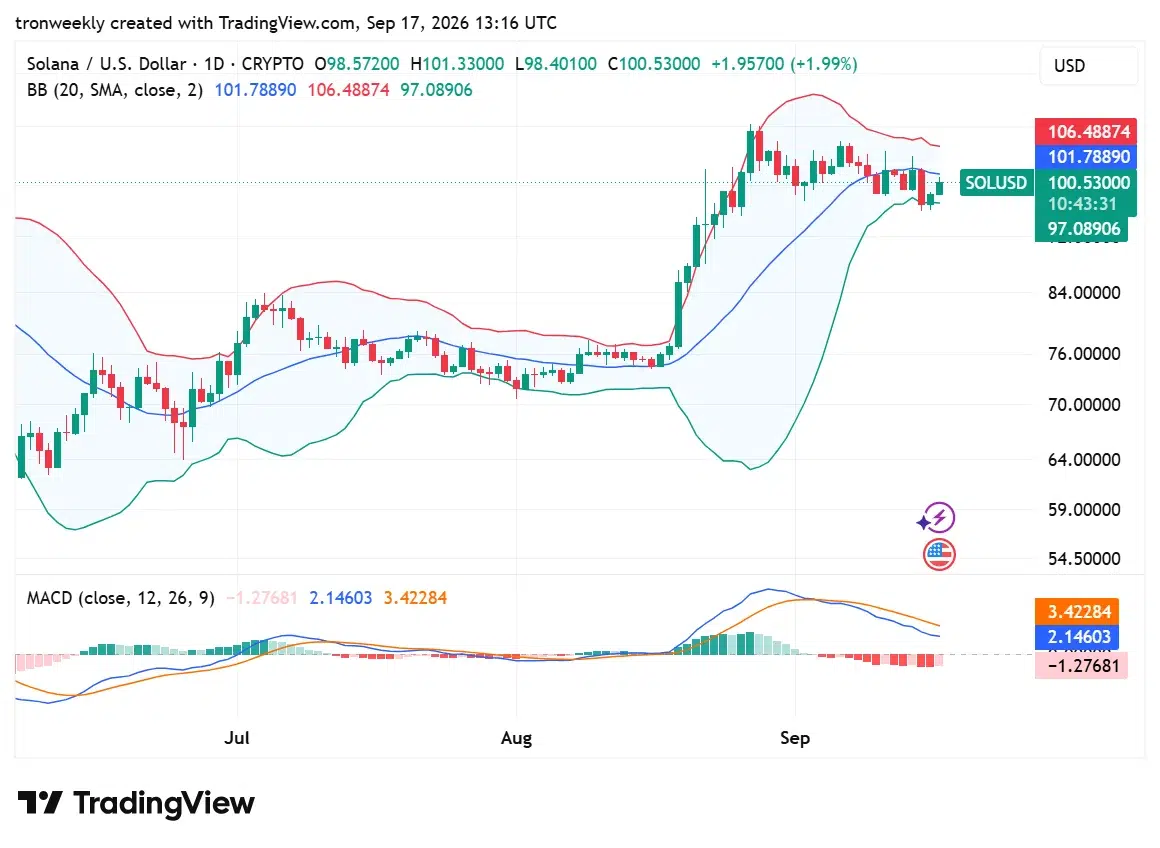
MACD line is currently at 2.14603 and below the signal line, which is currently at 3.42284. The histogram reading is currently negative at -1.27681. This combination of the MACD signals weakens bullish momentum after recent gains for Solana.
Tokenized Stocks Add Another Solana Catalyst
Apart from price action, Solana has also been gaining traction with respect to the growth of tokenized equities.
Solflare has introduced over 750 tokenized equities in its xStocks listing, including many stocks in its wallet service. Some of these tokenized equities belong to popular brands like Nike, Disney, and Airbnb.
The reason why the news is important is that it ties Solana’s technology to traditional finance. The tokenization of equities ensures that stocks and ETFs can be tokenized, traded, and moved via the blockchain network of Solana.
Regulatory Shift Could Support Tokenization
The trend towards tokenization is also emerging along with changes in regulation.
On September 17th, the Securities and Exchange Commission of the United States announced a five-year exemption that aims to help certain blockchain-based trading of tokenized stocks and securities. This framework offers a conditional exemption from some of the requirements usually expected of exchanges and dealers.
This is not an automatic means of ensuring increased activity on Solana, but it indicates that tokenized securities have become a more important factor in the debate surrounding blockchain-based financial infrastructure.
In the case of Solana, tokenized stock, DeFi, and real-world assets make up yet another means of ensuring network activity.
What Happens Next for Solana Price?
However, the immediate question is whether SOL will be able to stay above the $100 level and rise above the midline of its present Bollinger Bands channel.
For example, if the price moves towards the upper Bollinger Band near $106.49, it will indicate a technical test of strength. If the price falls below the $97.09 lower band level, it will be crucial.
In addition, the weekly 100 SMA and 150 SMA construction emphasized by Trader Tardigrade will be monitored for confirmation purposes. A successful crossover may reinforce the case for SOL expansion made by the analyst, whereas failure of the construction leaves Solana vulnerable to consolidation.
The larger Solana story has been unfolding not only on the price charts. The quick development of tokenized equities and integration of real-world assets into DeFi might provide some extra utility for the platform in the future.
Also Read | Revolut Hackers Demand $3 Million in Monero After Customer Data Breach
This article contains market analysis and price predictions. These are not guarantees. Crypto markets are volatile. Always DYOR. Not financial advice.



Be the first to comment