



Bitcoin price surged more than 5% on Sep. 18, breaking above $80,000 as a 4-hour trend reversal and concentrated short liquidations accelerated the recovery from $75,560.
Summary
- Bitcoin price gained 5.49% and reached an intraday high of $81,258.
- Price now trades above the 20-, 50-, 100-, and 200-day moving averages.
- 4-hour Aroon Up reached 100%, while the Supertrend flipped bullish.
- Liquidation clusters near $81,500–$82,000 could shape Bitcoin’s next move.
Bitcoin price rebounds from $75,560
According to data from crypto.news, Bitcoin (BTC) price was trading near $80,600 at the time of writing after opening the daily session at $76,417. The 5.49% advance reversed most of the losses recorded during the earlier decline from the $80,000 area.

The move followed a drop to about $75,560, Bitcoin’s lowest level this month. Buyers first stabilized the price around $76,000 before pushing it through the $78,000 and $80,000 levels in two rapid advances.
Bitcoin briefly touched $81,258 during the rally but pulled back below $81,000, showing that sellers remain active near the upper end of its recent range. Even so, the daily candle remains strongly positive, with its real body covering more than $4,000.
The recovery also returned Bitcoin to the range it held before the Sep. 15 sell-off. Price must now remain above $80,000 to turn the former resistance level into support and reduce the risk of another retreat into the high-$70,000 area.
The rally came after bearish positioning increased during Bitcoin’s fall below $76,000. The supplied market data showed that forced buying from short liquidations helped speed up the rebound once the price began clearing nearby resistance.
Daily indicators support the Bitcoin breakout
Bitcoin has moved above all four moving averages displayed on the daily chart. The 20-day simple moving average sits at $78,150, making it the closest dynamic support following the breakout.
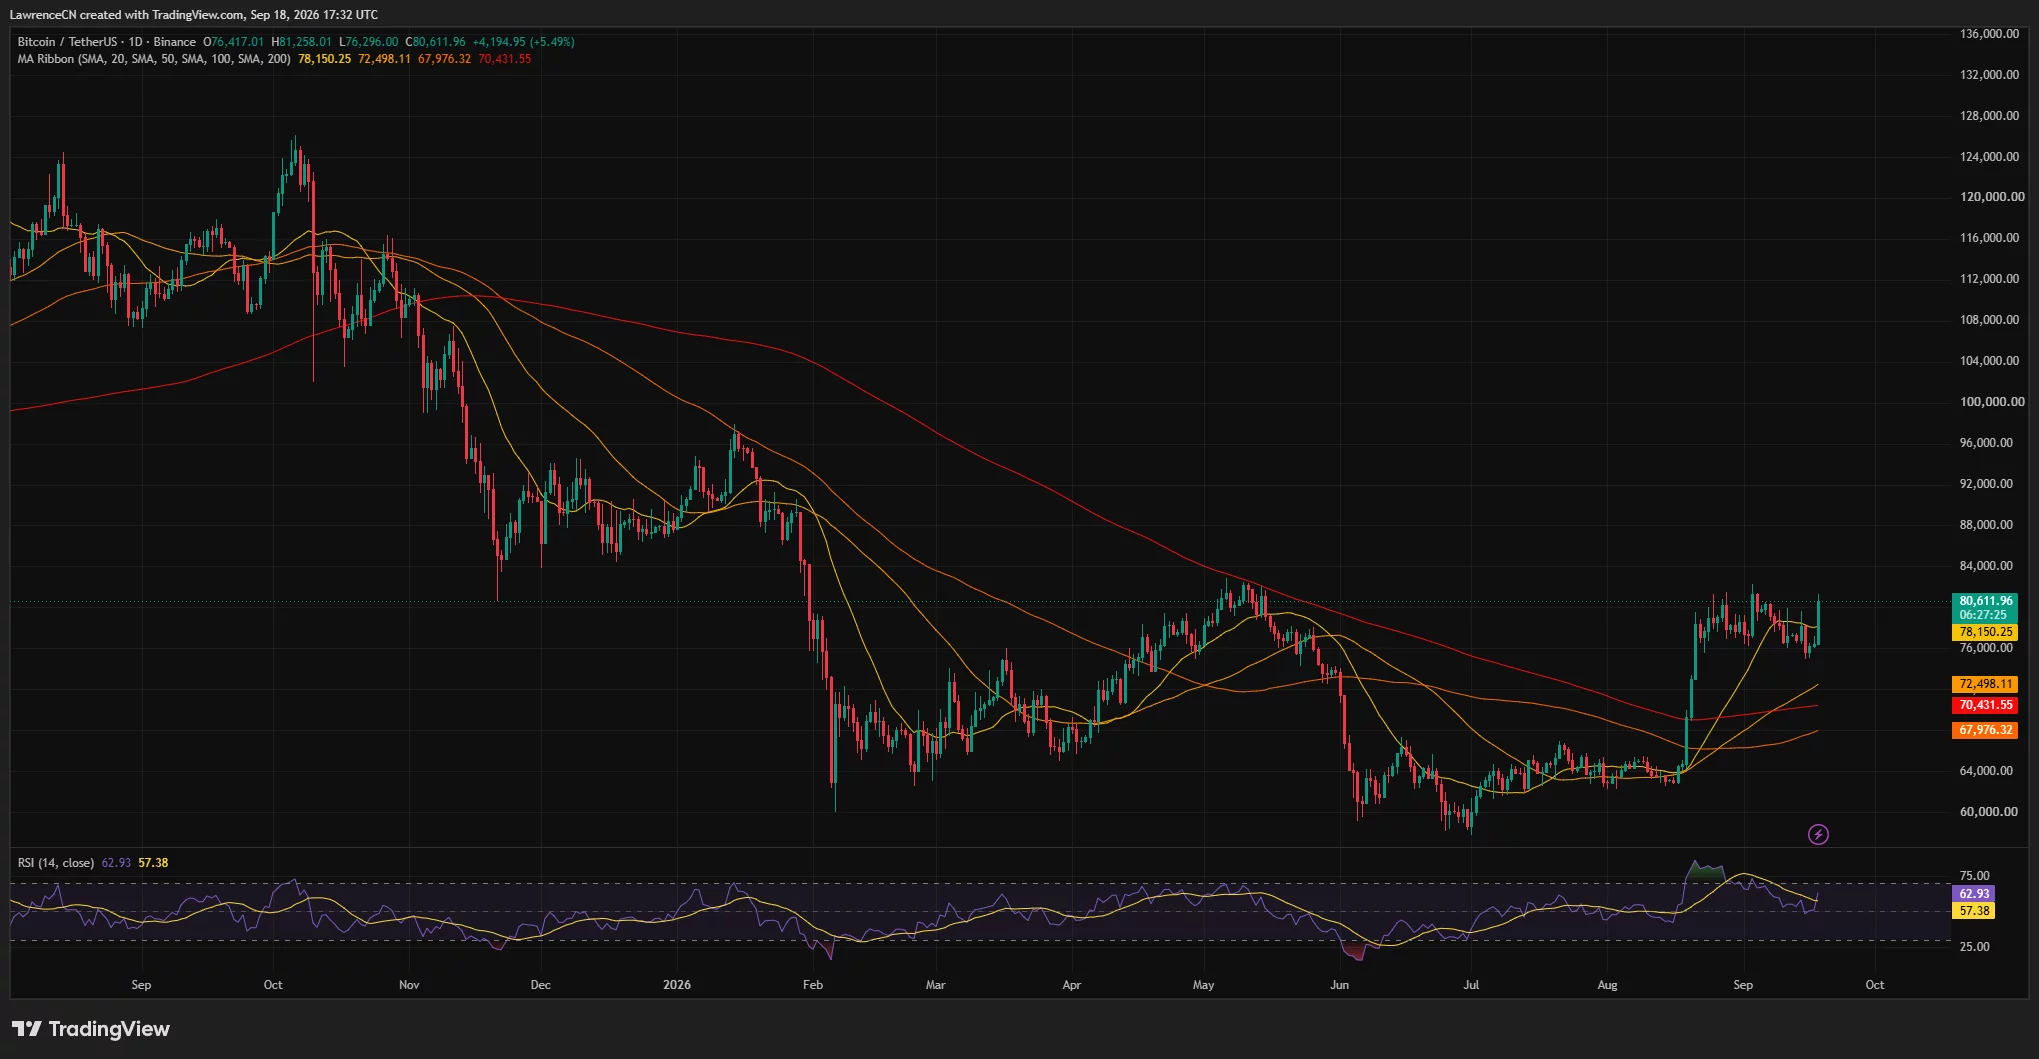
The 50-day SMA stands at $72,498, while the 200-day and 100-day averages are near $70,432 and $67,976, respectively. Bitcoin’s position above those longer-term averages keeps the wider recovery structure intact despite the volatility recorded during September.
The daily relative strength index rose to 62.93, above its moving average of 57.38. An RSI above 50 shows that upward momentum has strengthened, while the current reading remains below the commonly watched overbought level of 70.
Bitcoin is therefore gaining momentum without showing an extreme daily RSI reading. A move above 70 would signal stronger buying pressure, but it could also increase the risk of a short-term pullback if price reaches resistance near $82,000.
The daily structure still leaves Bitcoin below the local May high and the upper boundary of its recent trading range. Bulls need a daily close above approximately $82,000 to establish a higher high and provide stronger evidence that the September correction has ended.
4-hour Bitcoin chart flips bullish
Bitcoin’s 4-hour chart recorded a bullish Supertrend shift during the latest advance. The indicator now places trend support near $77,828, while price has also cleared the previous bearish Supertrend line around $78,597.
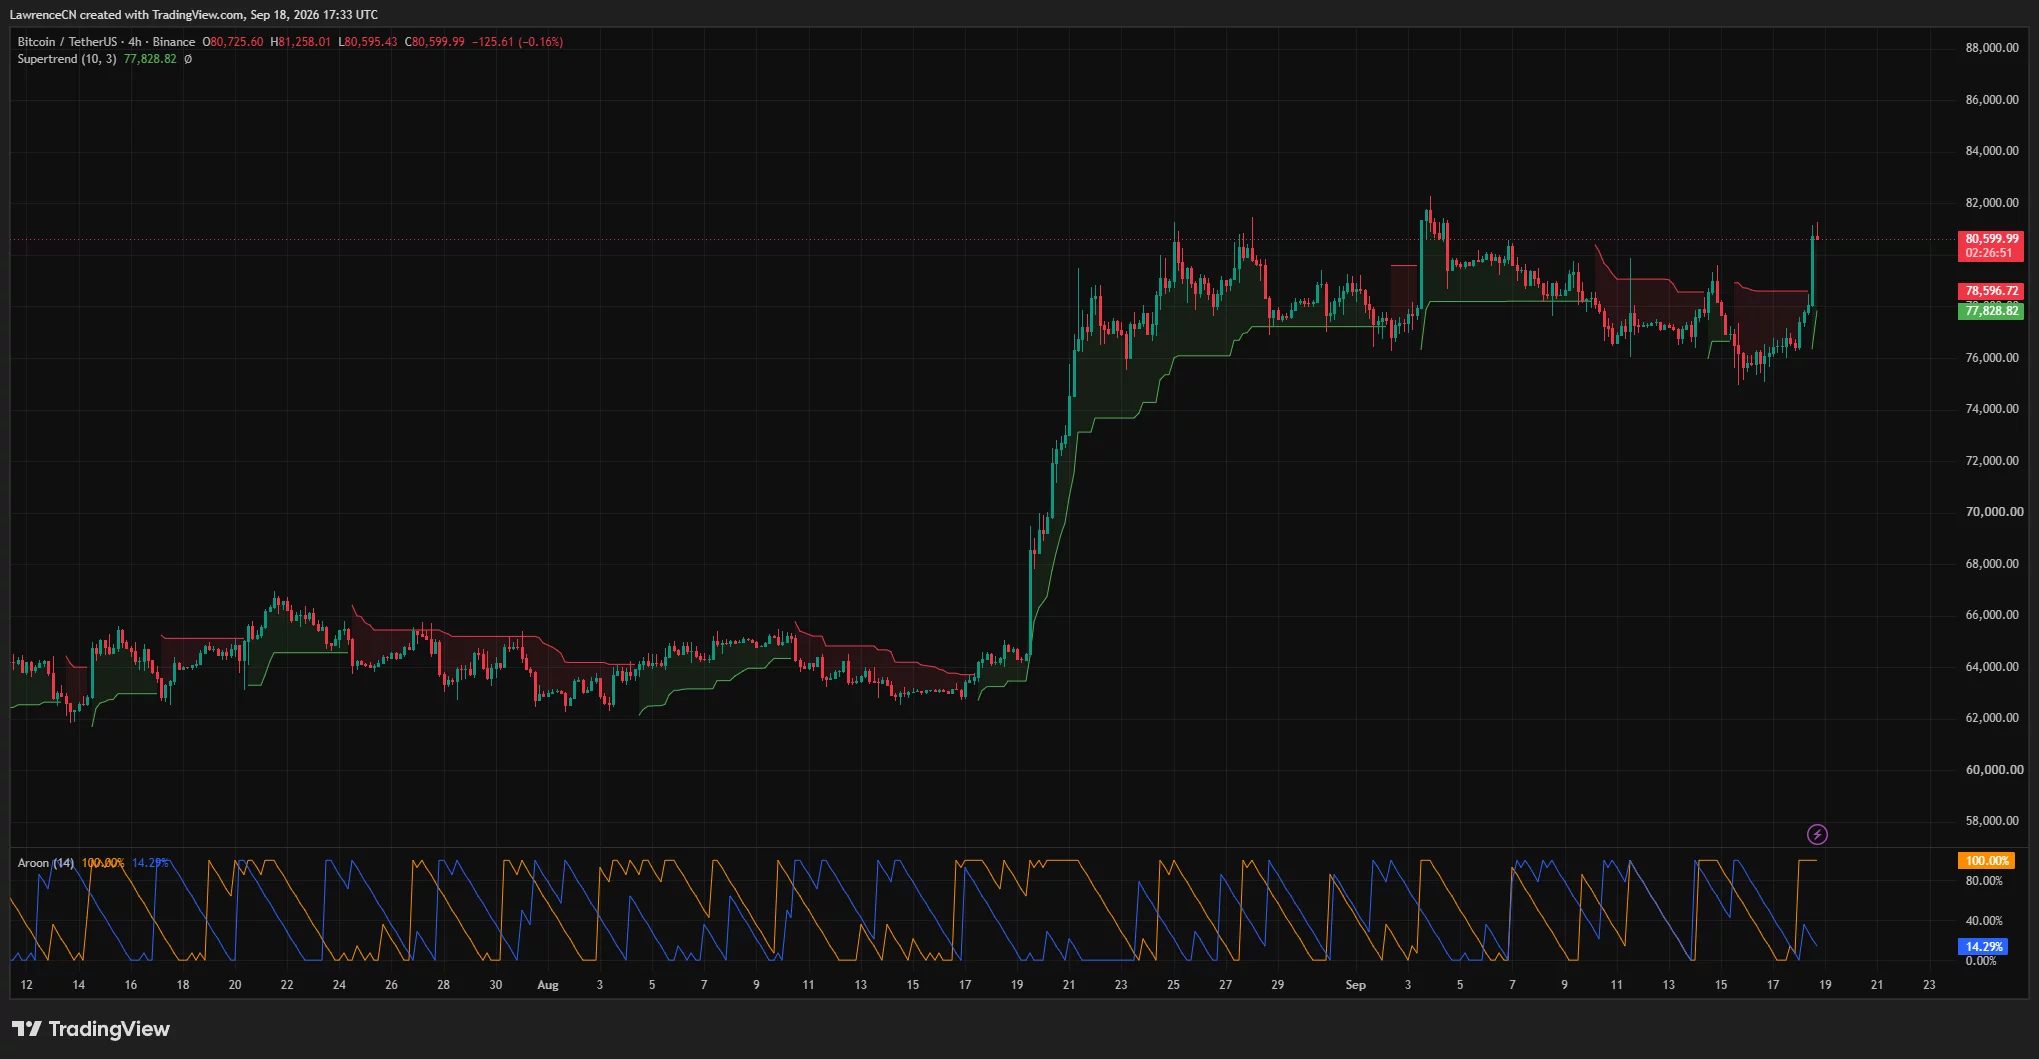
A 4-hour close above that former resistance strengthens the breakout because it shows that buyers held control beyond the initial price spike. The $78,600 area could now act as support during any retest.
The Aroon indicator also shows a sharp change in short-term momentum. Aroon Up reached 100%, while Aroon Down fell to 14.29%, indicating that the period’s most recent high occurred much later than its latest low.
Bitcoin remains exposed to a cooling period after its near-vertical 4-hour advance. A pullback that holds between $78,600 and $80,000 would preserve the new bullish structure, while a drop below the Supertrend support at $77,828 would weaken it.
A close below $77,800 could send Bitcoin back toward $76,000 and the monthly low near $75,560. Losing that low would invalidate the immediate recovery setup and reopen the path toward the daily moving-average cluster between $72,500 and $70,400.
Liquidation map puts $82,000 in focus
CoinGlass’ 24-hour Bitcoin liquidation heatmap shows several leveraged-position clusters above the current price. The nearest large concentrations appear around $81,500 and $82,000, with additional liquidity extending toward $84,000.
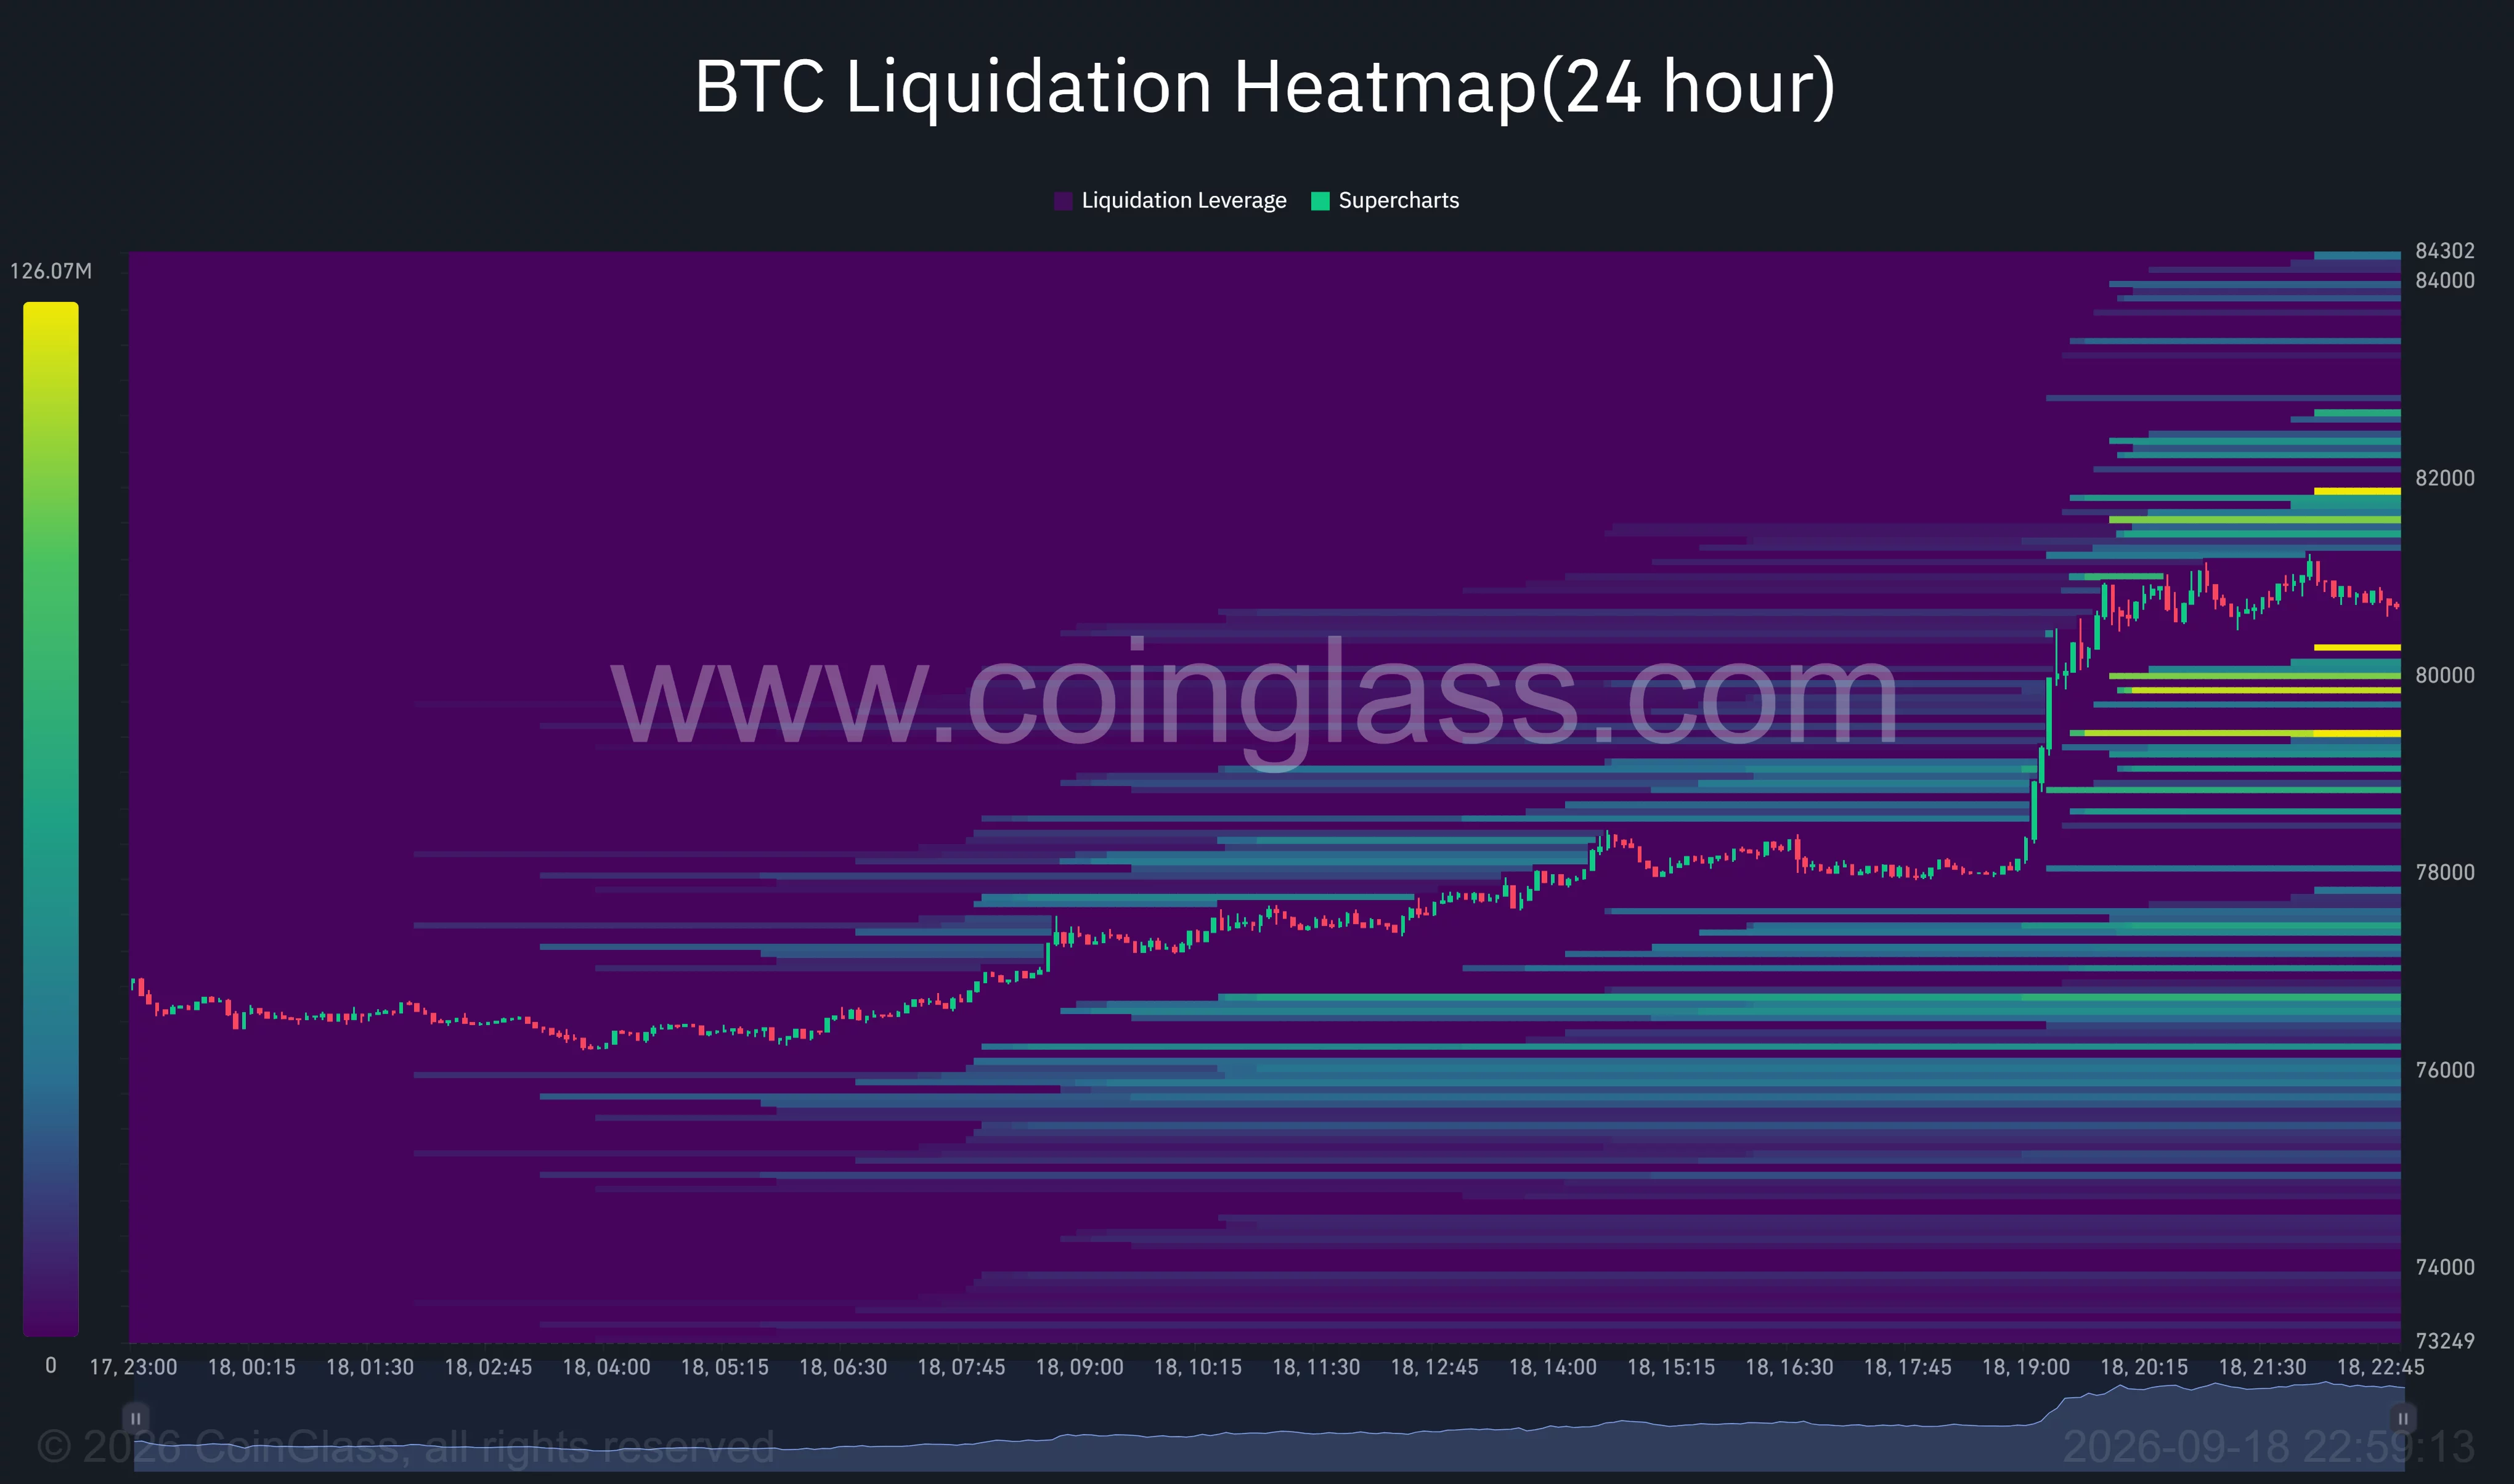
Leveraged short positions can face forced closure when Bitcoin rises into those zones. Such liquidations create market buy orders, which may add momentum if price breaks above $81,500 with sufficient volume.
The heatmap also shows liquidity below the market around $80,000 and $79,300. Larger bands are visible between roughly $76,000 and $77,500, making that region a possible target if Bitcoin fails to hold its breakout.
Liquidity concentrations do not guarantee that price will reach a given level. They identify areas where leveraged positions may be vulnerable, making volatility more likely when Bitcoin approaches them.
The immediate bullish path requires a break above the intraday high at $81,258, followed by a sustained move through the $81,500–$82,000 liquidity zone. A successful breakout would leave approximately $84,000 as the next visible area of concentrated liquidations.
Analyst sees descending-channel breakout
Crypto analyst Batman said Bitcoin had broken out of a descending-channel formation similar to an earlier setup that preceded a 24% gain. His chart compared the latest September structure with a channel that formed before Bitcoin’s August advance.
“$BTC just broke the same descending channel setup that led to a 24% move last time,” the analyst wrote.
Batman said the latest breakout had further continuation potential, although the earlier 24% move does not guarantee that Bitcoin will repeat the same performance. Confirmation still depends on whether the price can hold above the channel and clear the nearby $82,000 resistance.
For U.S. traders, the next test will also depend on how the rally holds through the next session, when deeper spot and derivatives liquidity can either confirm the breakout or expose it as a short-covering move. Until Bitcoin records a daily close above $82,000, the charts support a short-term bullish reversal rather than a confirmed breakout from the wider range.
Disclosure: This article does not represent investment advice. The content and materials featured on this page are for educational purposes only.


Be the first to comment