



Dogecoin price is exhibiting indications of a breakout after sustaining the $0.078-$0.080 level, with a descending triangle indicating a move towards $0.11 if DOGE breaks through its upper trend line.
At the time of writing, DOGE is trading at $0.08749, with a 24-hour trading volume of $1.72 billion and a market capitalization of approximately $15.03 billion. The token has gained 7.04% over the last 24 hours.
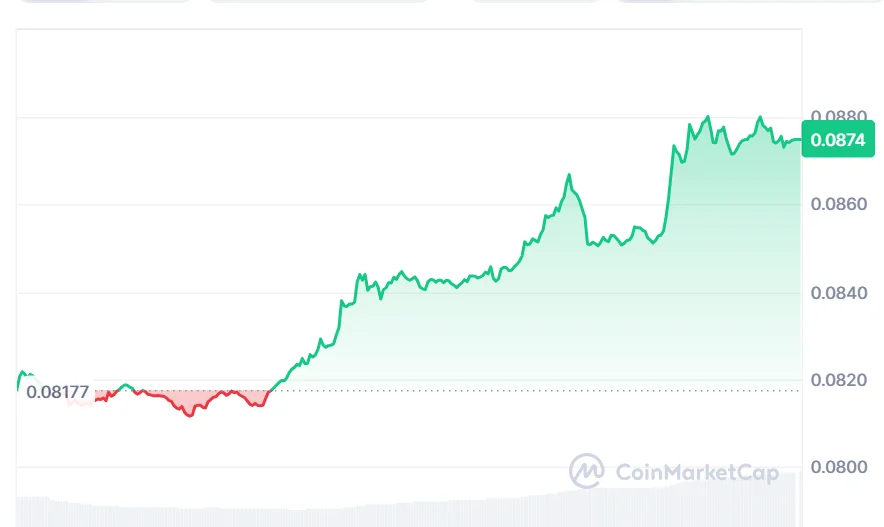
Dogecoin’s latest move comes in an attempt to bounce back from the previous pullback while still keeping its critical technical support level.
Also Read | XRP Price Targets $2 as Evernorth Secures $30 Million XRP Funding

Dogecoin Falling Wedge Signals Possible Breakout
On September 18, crypto analyst Crypto With Gopal pointed out the falling wedge pattern on the DOGE/USDT chart.
This is a consolidation pattern in which Dogecoin is trading between two downward-sloping lines, with the buyers defending the bottom zone at $0.078-$0.080. In accordance with the crypto analyst’s chart, breaking the upper line could result in reaching the $0.11 region.
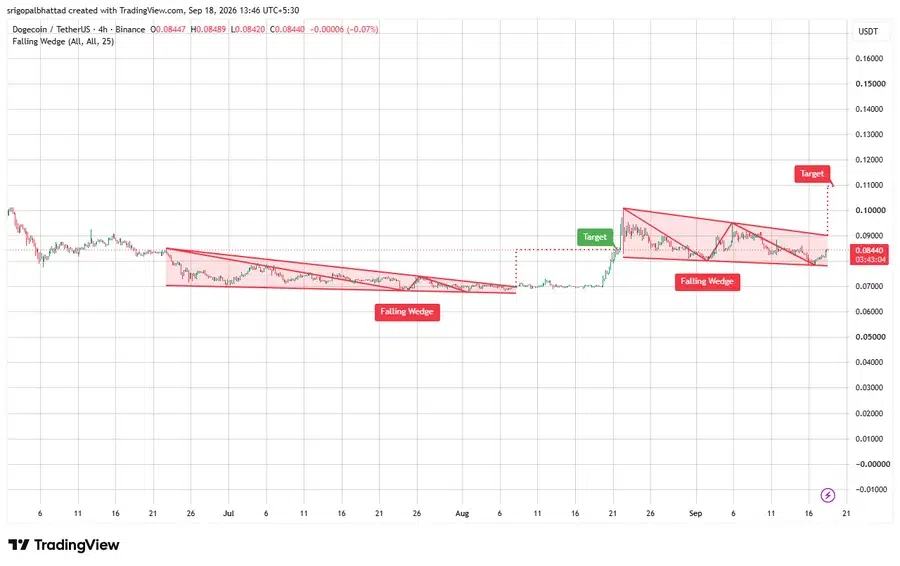
This is crucial due to the fact that wedging formations are usually traded on breakouts to the upside in order to indicate a possible bullish reversal formation at the point when prices break out above the upper trendline. Nevertheless, in order for this to be confirmed, the Dogecoin price should go above its resistance and stay there.
The target level at $0.11, which is being suggested by the chart, is quite a large one from the current levels.
DOGE Holds Above Bollinger Bands Middle Line
Dogecoin is currently trading at $0.08749, which is above the Bollinger Bands middle line of $0.08483. The upper Bollinger Bands line is at $0.09161, while the lower line is at $0.07804.
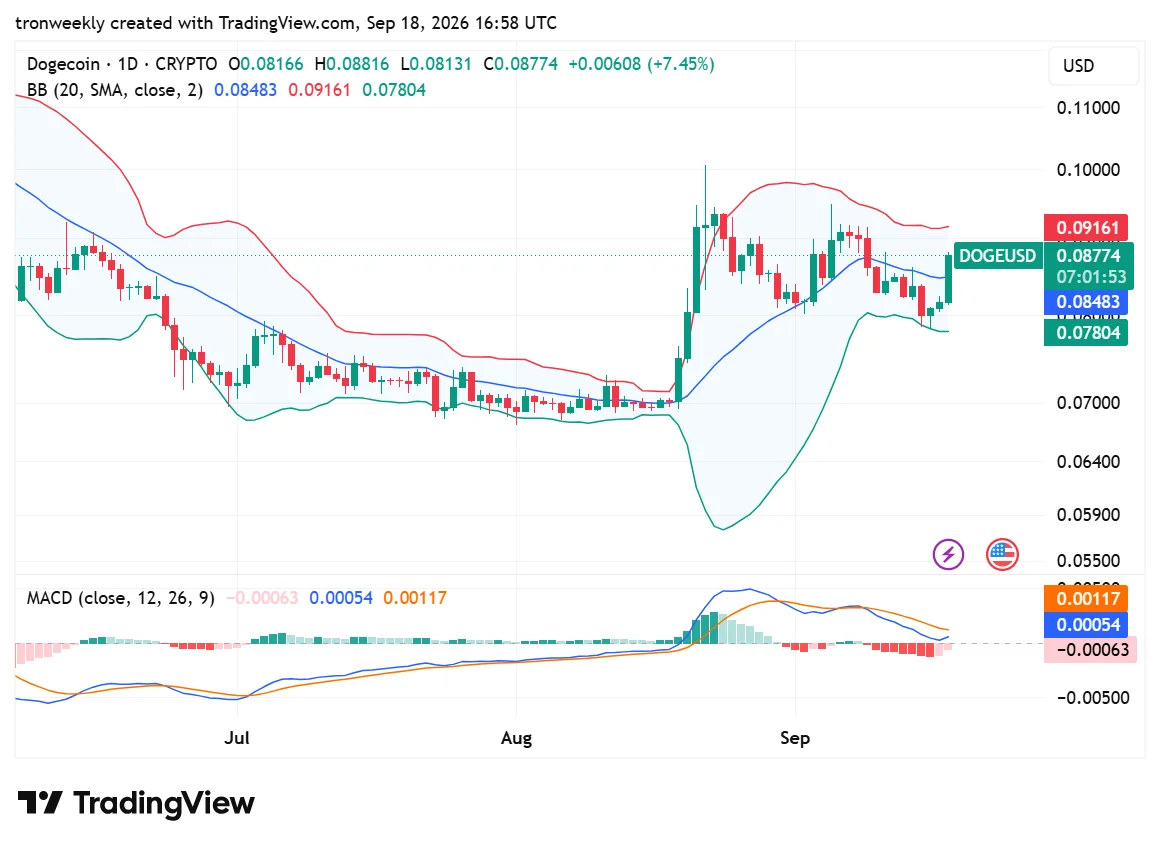
The MACD line is at 0.00054, which is below the signal line of 0.00117. The histogram is at -0.00063. This indicates that bearish momentum is still strong, even though DOGE.
Dogecoin Gains More Than 20% in 30 Days
However, the overall performance of Dogecoin is also vital to consider.
According to BSCN, as of September 18, DOGE was up by more than 20% in the past 30 days, owing to the accumulation of whales and some ETFs.
CoinMarketCap, in early September, mentioned the accumulation of large wallets of DOGE in the $0.08 region, despite the fact that the accumulation of such wallets does not guarantee a rise in price.
As highlighted by crypto analyst Ali Martinez, the whale wallets held an estimated 19 billion DOGE after accumulating more than 240 million DOGE from September 15th. The previous amount was about 18.72 billion DOGE.
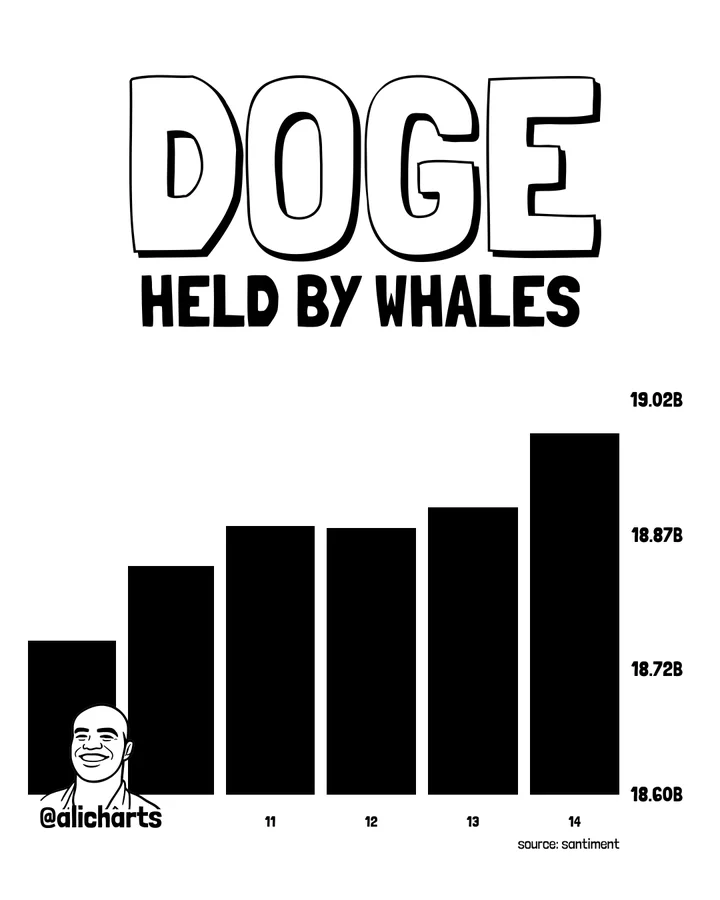
This is important because large wallet buying can help to offer some support during pullbacks, but ultimately price is determined by market demand and selling pressure.
Why the $0.08 Support Matters
The $0.078–$0.080 range has become a significant zone for DOGE since the crypto has witnessed some accumulation while prices were declining.
As long as DOGE manages to stick around in this range, the falling-wedge pattern is going to stay intact, and Dogecoin can test the upper resistance level. The upside breach of the nearby $0.091–$0.092 level will be a new level to keep an eye on until the $0.11 objective suggested by Crypto With Gopal.
However, a break below the $0.078 support level will destroy the falling-wedge pattern.
What Comes Next for Dogecoin Price?
The next significant move in the Dogecoin market will probably involve the ability of buyers to drive DOGE above the top edge of its falling wedge formation.
In the meantime, three key levels are being followed in the market at the moment: support around $0.078-$0.080, resistance around $0.091-$0.092, and an upside level of $0.11 as determined by falling-wedge analysis.
The 30-day gain, whale accumulation, and bounce above the Bollinger Middle Band create a favorable technical context, but the bearish MACD signal and low ETF inflows make it clear why confirmation is needed.
Also Read | CFTC Relief Expands for Passive Crypto Software Providers
This article contains market analysis and price predictions. These are not guarantees. Crypto markets are volatile. Always DYOR. Not financial advice.


Be the first to comment