


Artificial Superintelligence Alliance [FET] price climbed 15% in 24 hours around $0.1794 as of at the time of writing. The price pump correlated with the renewed AI-sector demand, which implied stronger participation across the AI-linked crypto tokens.
Generally, the broader AI token sector gained approximately 9.4%, while the overall cryptocurrency market only rose by1.9%. This difference therefore reflected a stronger capital rotation towards AI-linked assets during the trading sessions.
Furthermore, the Artificial Superintelligence Alliance’s trading activity supported the move, with 24-hour volume rising roughly 9.8% to $132.27 million. The price recovery emerged alongside greater market participation.
Additionally, the sector backdrop also provided another context for FET’s relative strength. Notably, the AI-linked assets collectively pulled stronger interest as the narrative regained market attention.

Exchange reserves challenge the demand surge
However, FET’s price rally encountered an important supply test as exchange balances pushed into the opposite direction.
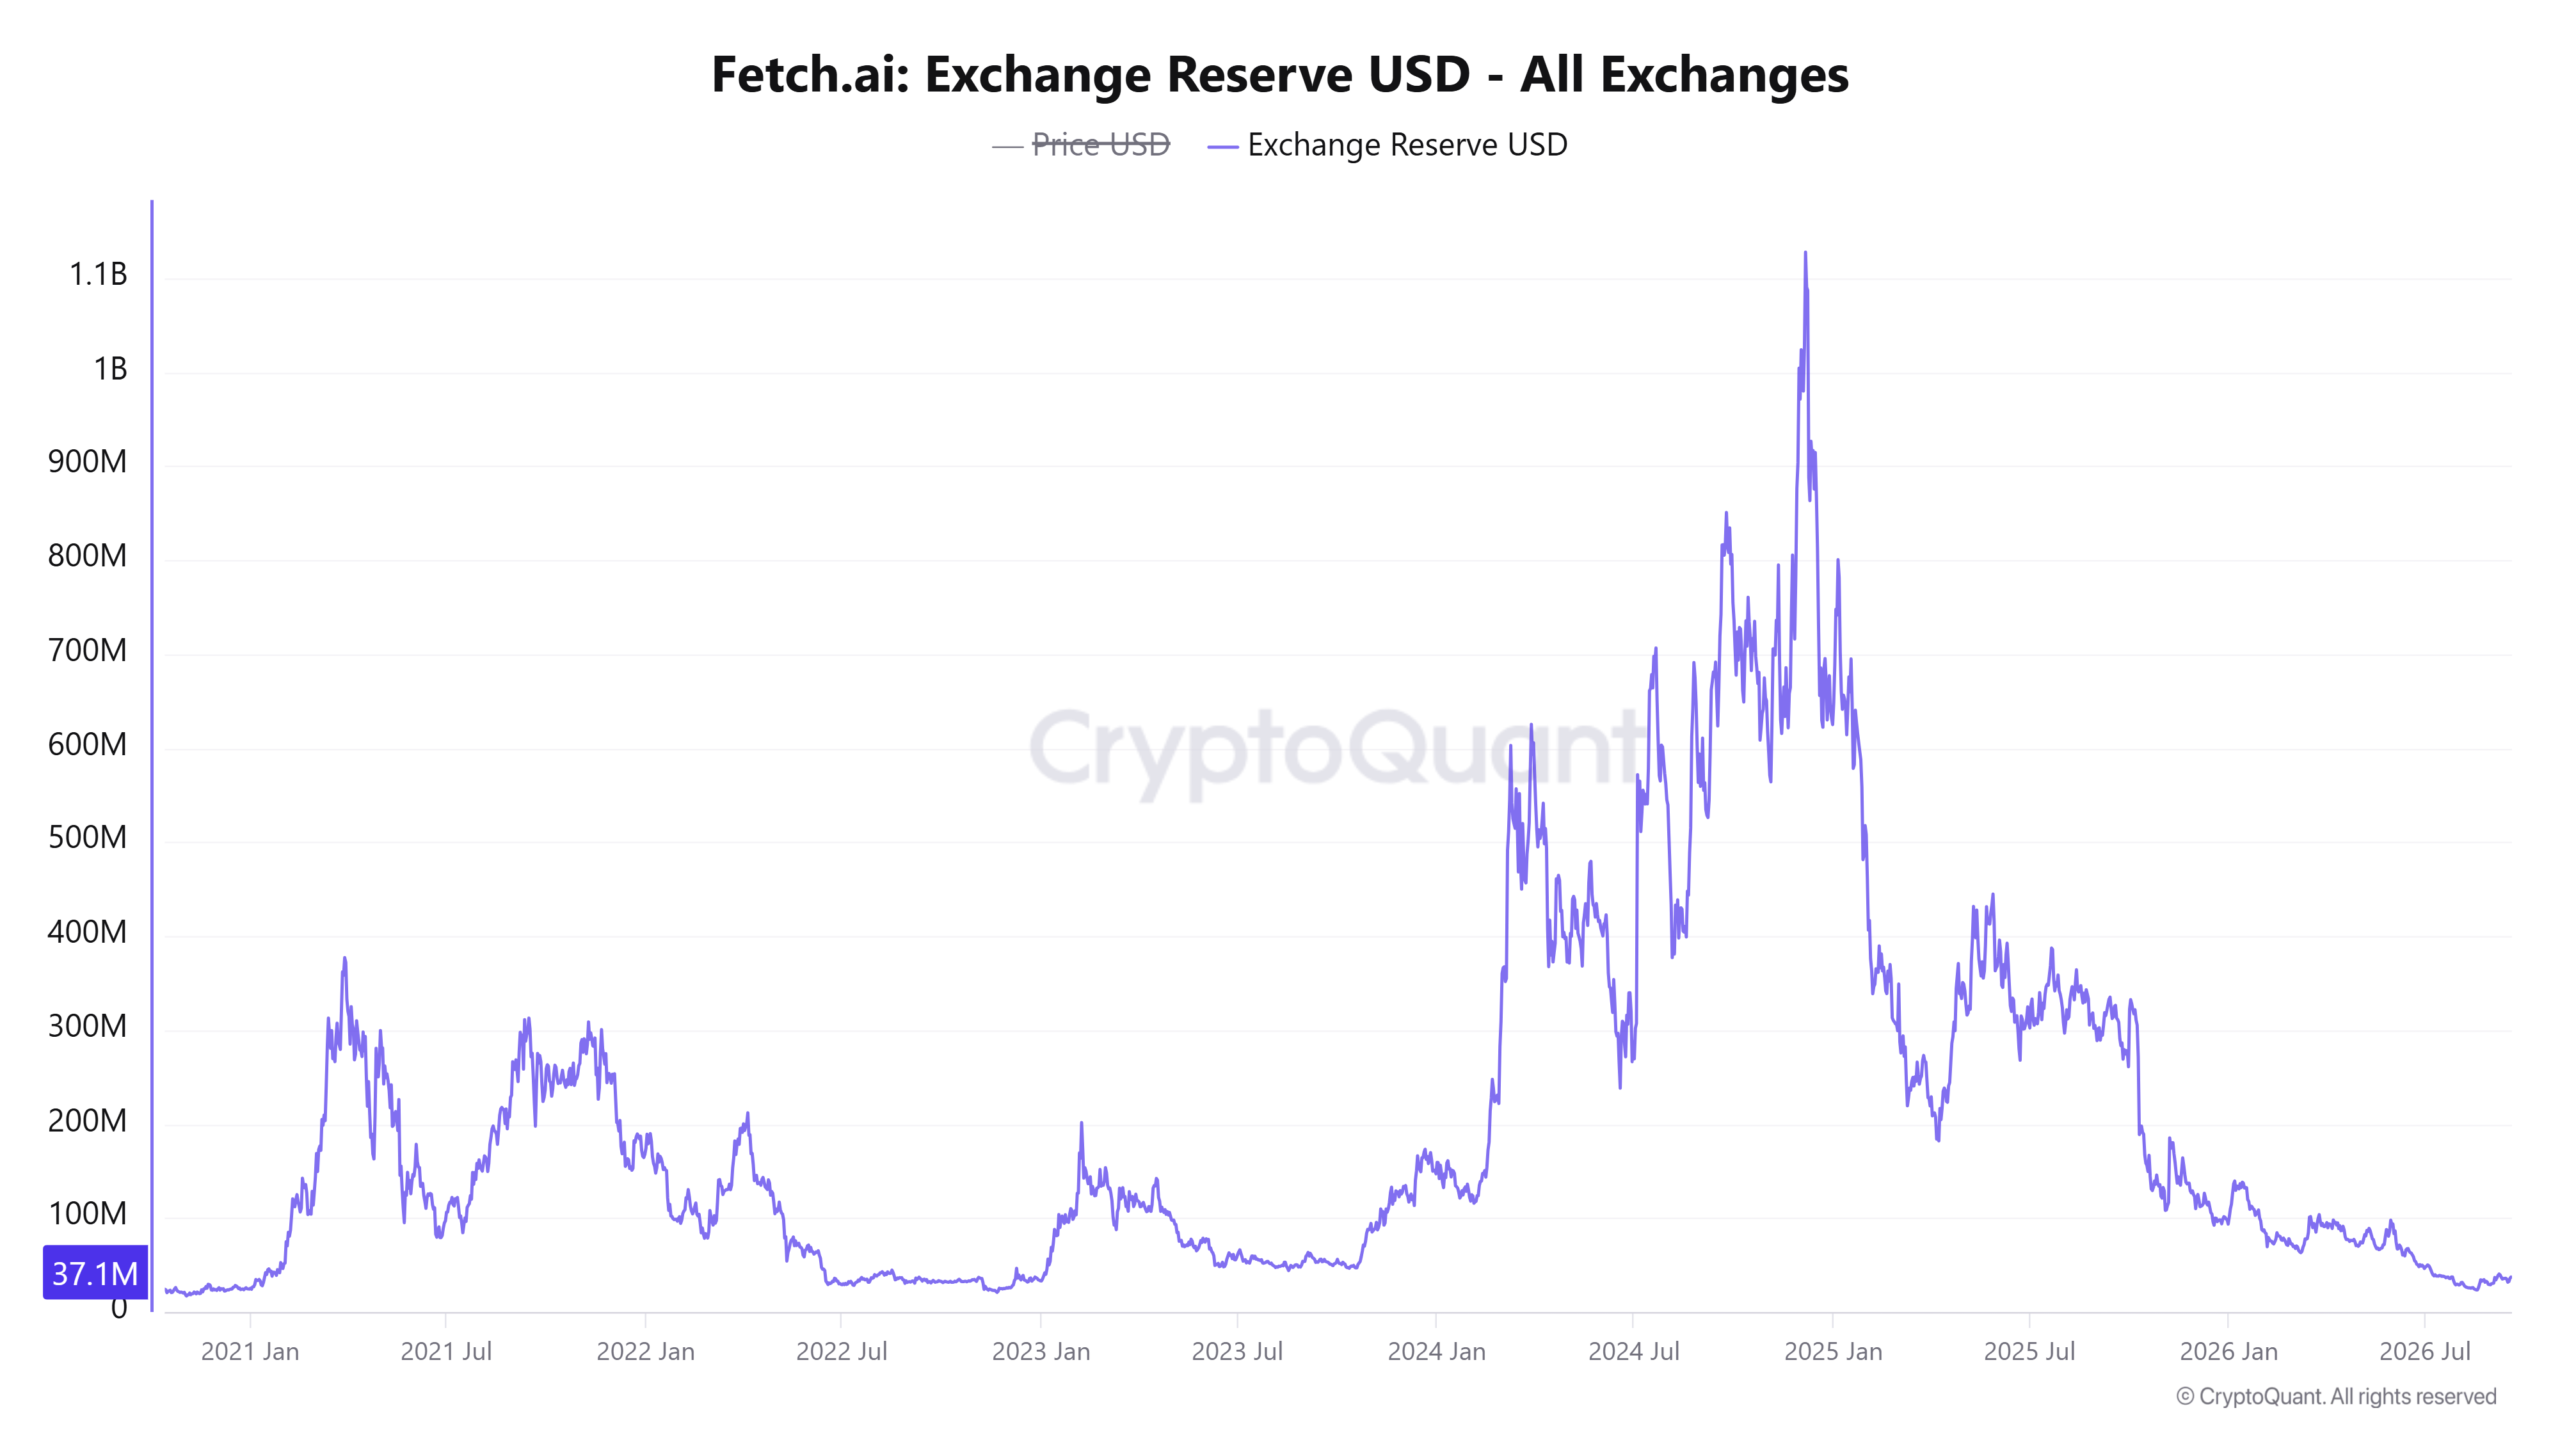
Accordingly, the Exchange Reserve USD was up 14.07% to $37.1 million in 24 hours, at the time of reporting. The rise in exchange reserve activity introduced more token value within the exchange wallets as buying pressure strengthened.
Generally, high exchange reserves can expand the readily available supply when token holders decide to sell. FET’s demand outlook therefore faced considerable pressure absorbing tokens already positioned near the trading venues.
However, the token’s price rose 13.8% despite the reserve expansion, implying the bulls had absorbed the rising exchange-side supply during the recovery period.
The rising trading volume also provided additional support from stronger market participation. However, continued reserve expansion could become more significant in case the buying activity weakens.
Top traders lean into FET’s rally
Also, FET’s derivatives market provided another perspective as market participants increased exposure alongside the recovery in the spot market.
Notably, the derivatives volume climbed 56.72% to $117.27 million as traders considerably increased activity around FET’s price advance.
Additionally, the Open Interest also expanded 10.51% to $82.63 million, implying the outstanding leveraged exposure grew during the price recovery.
Unlike the more rapid volume surge, the smaller Open Interest rise implied that substantial trading occurred alongside more measured position building.
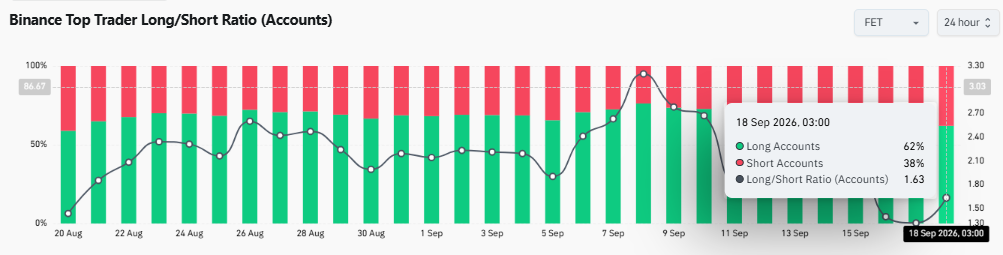
Importantly, the Binance top traders strengthened the bullish side of this positioning. According to CoinGlass data, the long accounts represented 62% of top traders, compared to 38% short accounts.
Consequently, the Binance Top Trader Long/Short Ratio hit 1.63, leaving long positioning clearly dominant among those accounts.
The derivatives traders therefore largely supported the spot recovery but the rising leverage could amplify volatility as Artificial Superintelligence Alliance approaches a technical key barrier.
Can FET clear the $0.1863 neckline?
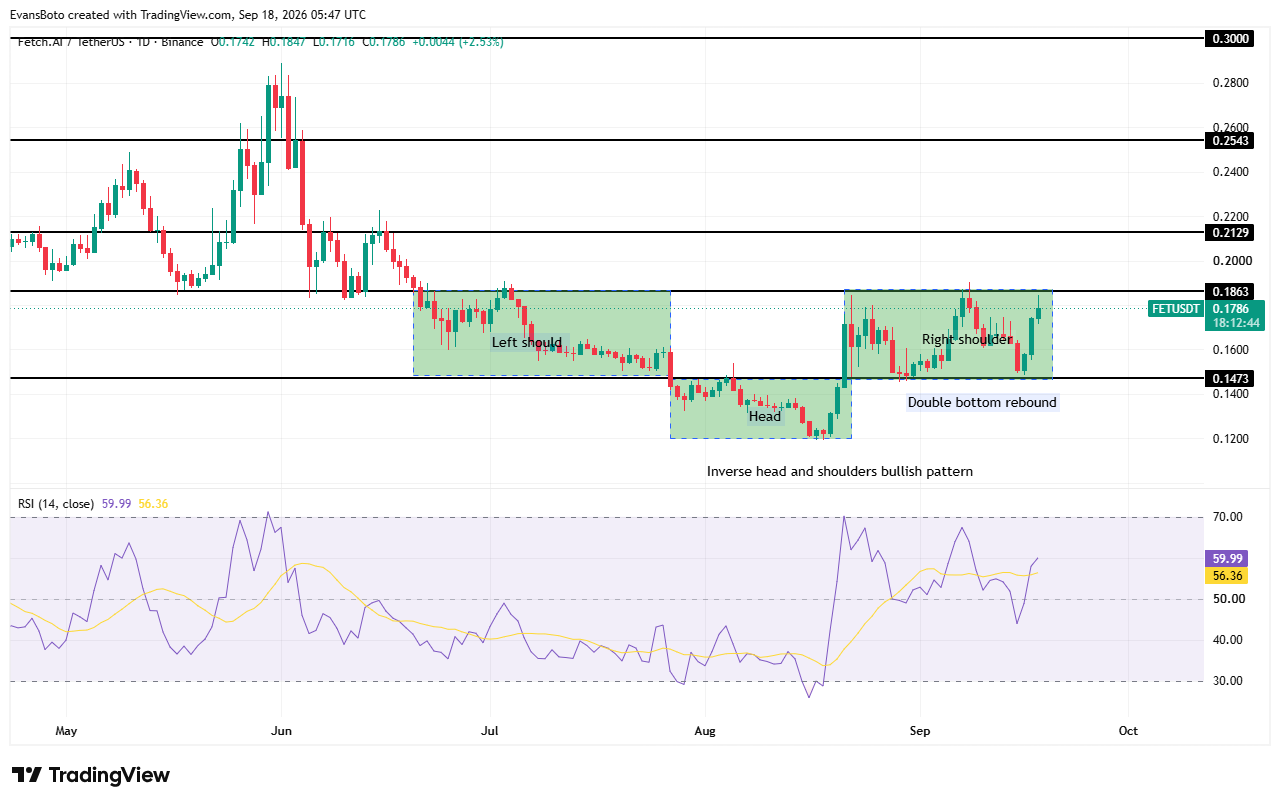
On the daily timeframe chart, FET rebounded from $0.1473 zone and pushed toward the $0.1863 level, where previous advances encountered resistance repeatedly.
Importantly, the broader structure formed an inverse head-and-shoulders pattern after the August’s decline toward the $0.12 price region.
Notably, the price formed the left shoulder above $0.1473 level before creating a deeper head during August sessions. The September’s technical recovery structure then created the right shoulder.
Also within that right shoulder, FET established a double-bottom rebound above the $0.1473 support. This recovery pushed price back towards the neckline zone.
Besides the technical structure, the RSI indicator also strengthened to 59.99 above its average signal, supporting improving buying strength.
A successful breakout therefore above the $0.1863 resistance would complete the bullish pattern, possibly exposing $0.2129 price zone as the next target. Further price expansion could then open path towards the $0.2543 supply area.
However, losing the $0.1863 support could turn attention towards the $0.1473 lower support area weakening the developing reversal structure considerably.
Final Summary
- FET’s 15% daily rally has brought the crucial $0.1863 neckline back into focus.
- Rising exchange reserves could test demand despite stronger derivatives activity and long positioning.






Be the first to comment