



Solana price has surged substantially as the updates in development on Solana have been accompanied by an increase in market momentum.
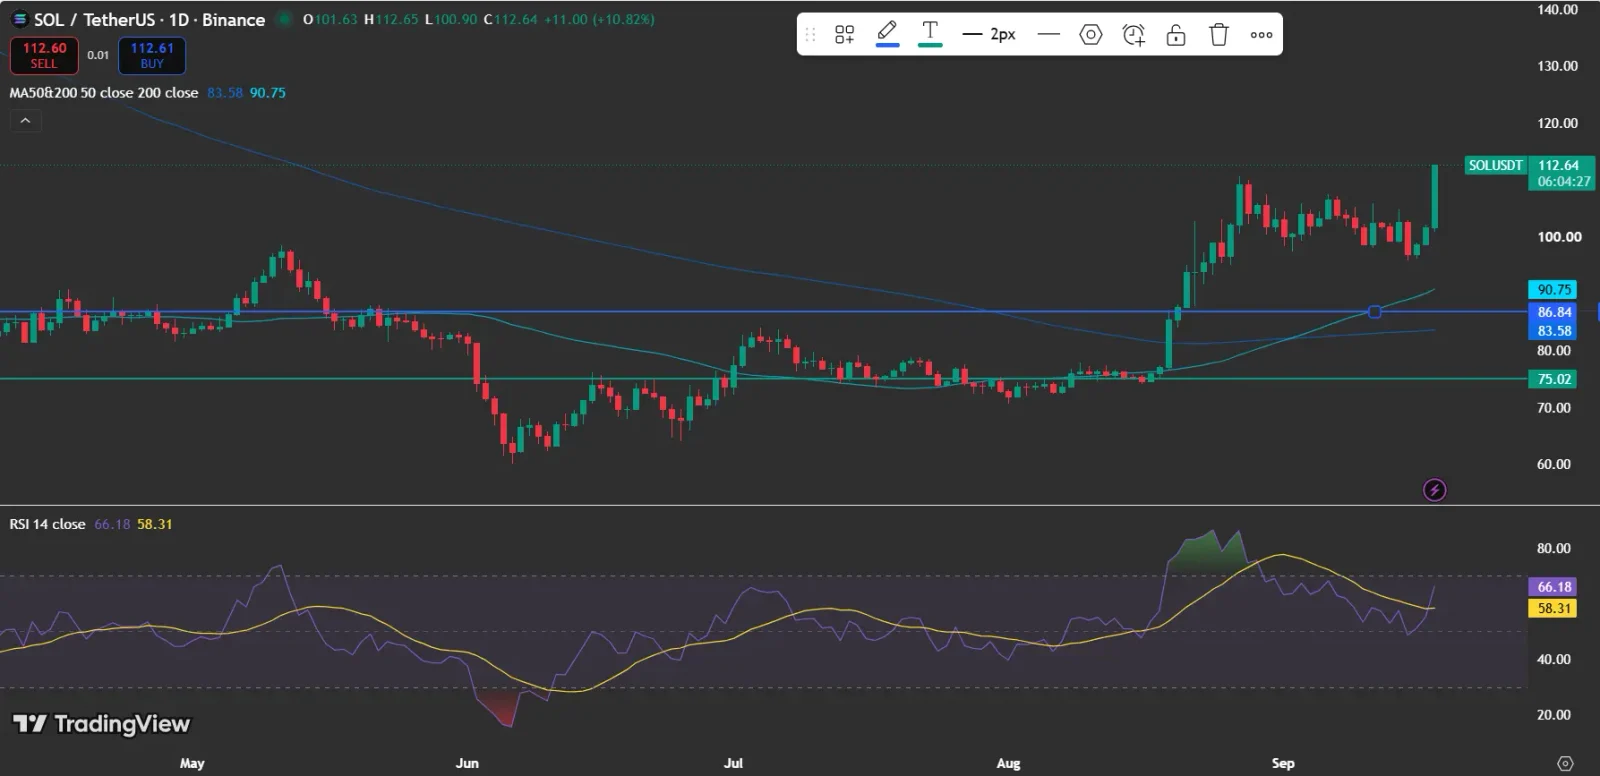
The current price of Solana is $112.64, which is a 10.82% surge in the price within 24 hours. The price surge has brought SOL closer to the upper end of the TradingView range, and the next significant price to watch out for is $120.
Also Read: INJ Price Eyes Breakout as Double-Bottom Setup Meets Solana Expansion
Why Is the Solana Price Moving Higher Right Now?
This latest development update is coming from Solana Developers, who have called attention to their Solana Changelog posted for September 18 via X.

The post highlights “Solana Changelog: September 18”, pointing readers toward ongoing updates in the network and developer ecosystem, thus placing today’s price action in fundamental context.
This is important because SOL has been stuck in consolidation between the $100–$108 area in September prior to the latest daily surge in prices. It means that there are now two factors traders can watch, rather than just the momentum of prices.
Also Read: Solana Price Eyes Major Expansion as SMA Crossover Forms
What Does the Solana Price TradingView Chart Signal?
On the daily chart, it can be seen that SOL trades significantly above both moving averages indicated. Thus, the 50-day moving average comes to $83.58, while the 200-day moving average equals $90.75. The current price is significantly higher than both.
Such a situation supports the continuation of the existing bullish trend. Nevertheless, the distance from the moving averages is quite big because of the quick move in SOL’s price.
The nearest resistance is $112.65, which is the highest daily point marked on the chart. The next significant level to watch is the psychological $120 level.
Can Solana Price Hold Above $110?
It seems that the momentum is strong because RSI stands at 66.18 compared to the RSI moving average, which is 58.31.
The RSI indicator is rising but does not exceed 70, meaning there is good momentum, but no sign of an overbought situation according to the common threshold of the indicator.
The core question is about SOL’s ability to hold its breakout rather than just piercing the resistance level.
Any sustained move above the last high will strengthen the breakout setup, while any move below the $100-$108 range will show that buyers find it hard to hold the latest rally.
Also Read: ZEC on Solana Soars to Powerful ATH in 2026 With 79% Lead
How Does the Solana Changelog Affect the Price?
The importance of the Solana Developers X release is in the fact that the continuous development can give important background to market movements.
No link between the Changelog and the price of SOL was established; hence, the technical breakout and the ecosystem update need to be considered alongside each other, rather than as evidence that one is directly affecting the other.
This information is important for traders analyzing the possible longevity of the current market trend. The situation where the development momentum and the strength of the price rise together gives the larger picture about SOL, while weak price performance makes the technical setup more important.
What Does Solana Price Futures Data Say?
According to data from CoinGlass provided in the charts, Solana open interest remained elevated after experiencing a strong rise amid the August movement.
In the last portion of the chart, open interest is shown at around the $6 billion mark, implying that a substantial amount of derivatives positions remain open in the market.
From the liquidations chart, a notable short-liquidation spike is seen amid the August move, and another notable short liquidation can be seen at the most recent part of the series.
In this case, one thing that needs to be considered is leverage, which means that further price increases can put pressure on short positions and trigger additional short liquidations, while price declines can put leveraged long positions at risk.
Also Read: Solana Price Risks Deeper Losses if SOL Breaks $60 Support
What Should Traders Be Looking At Next for Solana Price?
The present technical analysis marks $112.65 as the immediate breakout reference, while $120 represents the next significant psychological level visible on the chart.
On the downside, it is notable that the recent consolidation period occurred between approximately $100 and $108, while the 200-day moving average of $90.75 serves as a broad trend marker.
SOL’s latest move has seen both strong price momentum along with an RSI reading that has not yet breached the 70 level, as well as a considerable gap above its moving averages.
Fundamental considerations based on the September Changelog, along with high derivatives positioning, provide additional variables which may affect whether the breakout develops into a sustained trend.
The cryptocurrency market remains highly volatile, and traders should monitor price action, market sentiment, and upcoming catalysts before making investment decisions.
Also Read: Solana Price Eyes $233.8 as Trading Activity Surges and Tokenized Equities Grow
This article contains market analysis and price predictions. These are not guarantees. Crypto markets are volatile. Always DYOR. Not financial advice.


Be the first to comment