



The broader crypto market showed relative strength over the past days, with most altcoins breaking out. However, memecoins have remained slow to respond and have barely moved to the upside.
The sector’s market cap is down 4%, while trading volume is down 10%, as per CoinMarketCap. Interestingly, while memecoins are still showing strong weakness, MemeCore [M] has defined the trend and led the sector’s recovery.
In fact, MemeCore has closed at higher highs for four consecutive days. As a result, the memecoin flipped $1.70 and climbed to $1.76.
As of this writing, M was trading around $1.74, up 35% on the daily charts, extending its 43% weekly gains. At the same time, market cap reached $3.9 billion, marking a 35% increase, reflecting steady capital flow.

What’s driving MemeCore’s recent uptick?
The upside pressure has been maintained by continued derivatives pressure. According to CoinGlass data, MemeCore’s Open Interest surged 44% to $25.7 million, while derivatives volume rose 91% to $39 million.
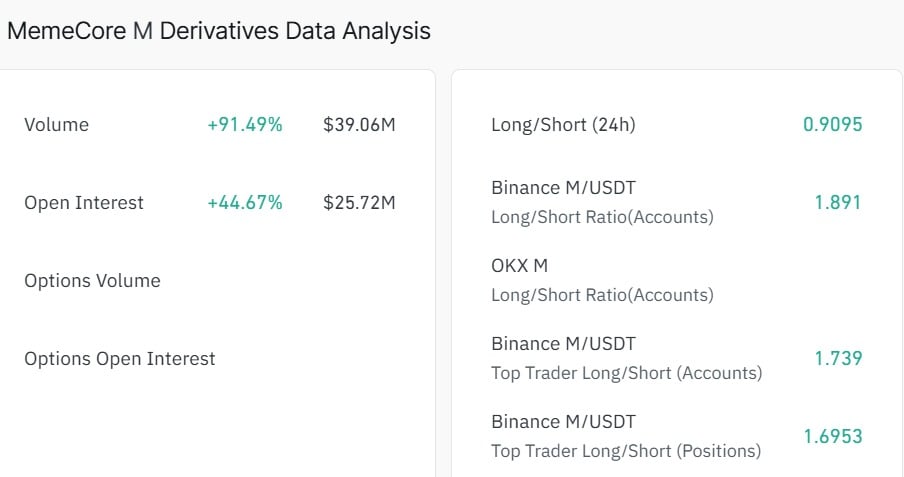
A strong jump in OI and volume reflected increased participation as traders opened new positions. On Binance, for example, it seems traders mostly opened leveraged longs.
This is so since the Long/Short Ratio on the exchange rose to 1.89. However, the overall ratio still holds below 1, around 0.90, suggesting all traders have yet to flip bullish.
Investors are still not expecting a sustained uptrend
Interestingly, although OI is rising, the recent price hike incentivized people to cash out. As such, both Futures and Spot have seen increased outflows.
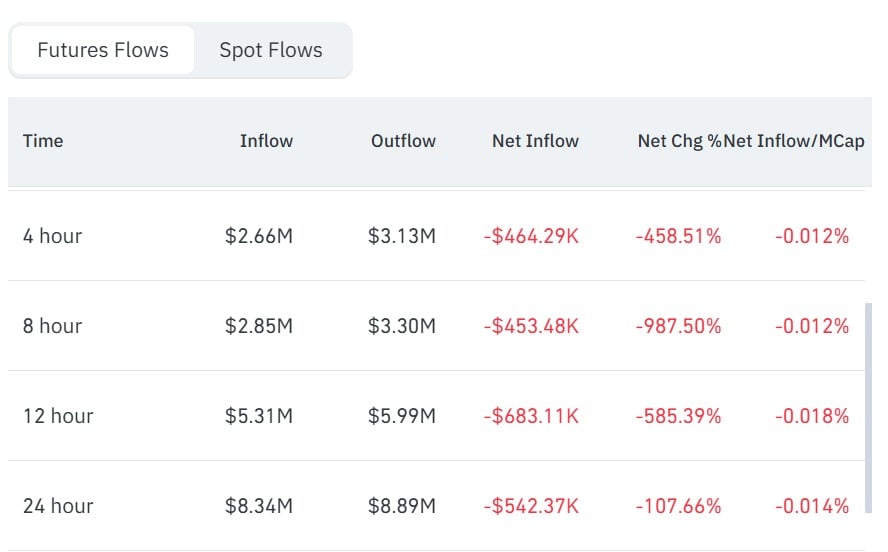
On the Futures side, MemeCore saw $8.89 million in outflows compared to $8.34 million in inflows. As a result, the Futures netflow dropped 107% to -$542k, a clear sign of aggressive selling.
On the Spot side, the memecoin recorded $444k in inflows compared to $415k in outflows. As a result, the Netflow rose 137% to $29k, suggesting traders have mostly cashed out recent gains.
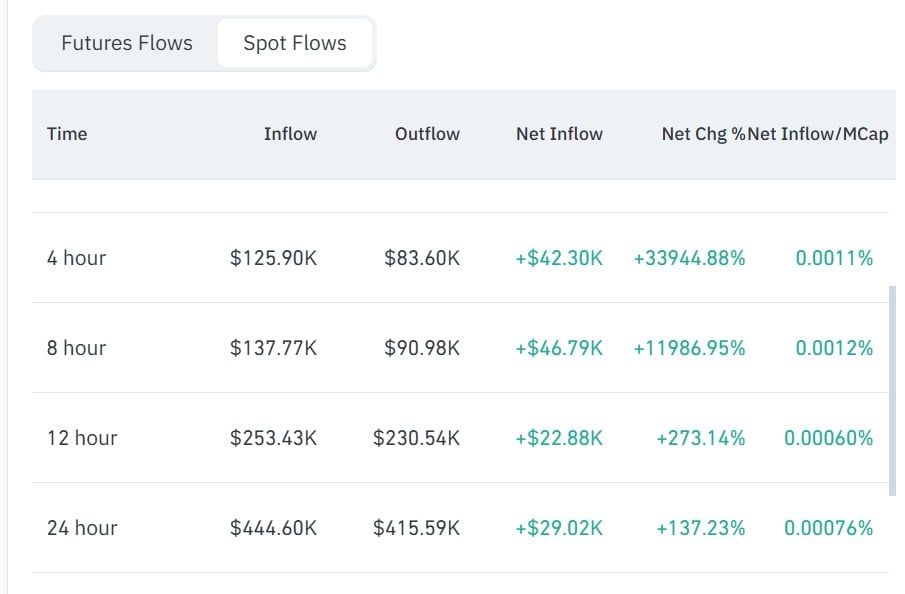
With outflows dominating, it risks the sustainability of the uptrend. Historically, increased outflows have preceded weakened market structure.
Can M hold its gains?
Despite the increased sell-side activity, the capital raising from the derivatives is holding the bullish structure. Momentum indicators confirm this view.
MemeCore’s Relative Strength Index (RSI) jumped to 78, nearing the overbought zone. Likewise, the Trends Strength Index (TSI) has also held in an upward trajectory, further confirming this uptrend.
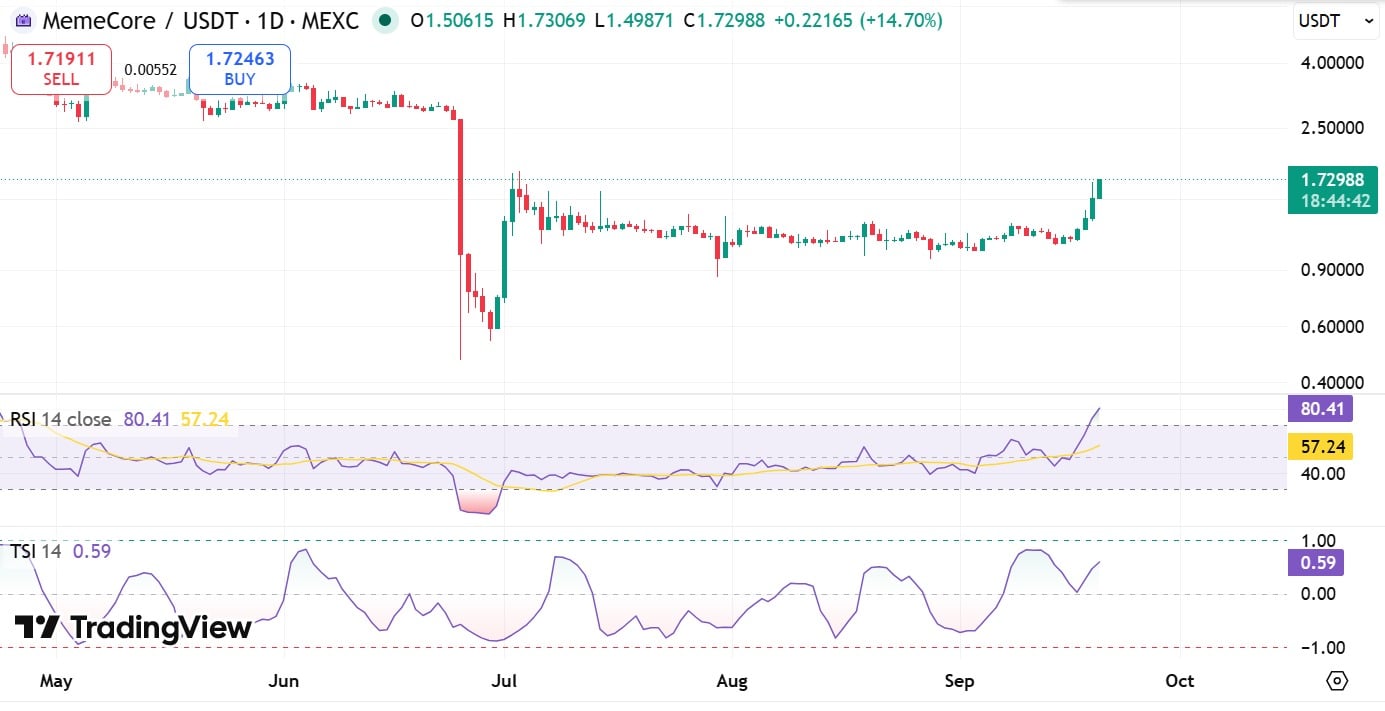
Taken together, these indicators suggest the likelihood of the trend’s continuation. If buyers can increase capital flow, MemeCore will flip $1.8 and aim for $2.
However, the source of demand has historically not sustainably held an uptrend. Also, intense selling pressure presents more downside risks. Thus, if the profit takers continue, M could revisit $1.2.
Final Summary
- M surged 35%, flipped $1.70, and touched a two-month high of $1.77 before slightly retracing.
- MemeCore shows strong upside momentum driven by derivatives pressure, but intense sell-side activity threatens another pullback.





Be the first to comment