



Avalanche (AVAX) reclaims its long-term trendline after a brief breakdown, strengthening its bullish structure. The token has moved above key moving averages as momentum improves. Meanwhile, cautious derivatives activity contrasts with stronger Avalanche network usage, leaving traders focused on whether the breakout can sustain further upside.
AVAX Price Reclaims Key Multi-Year Trendline
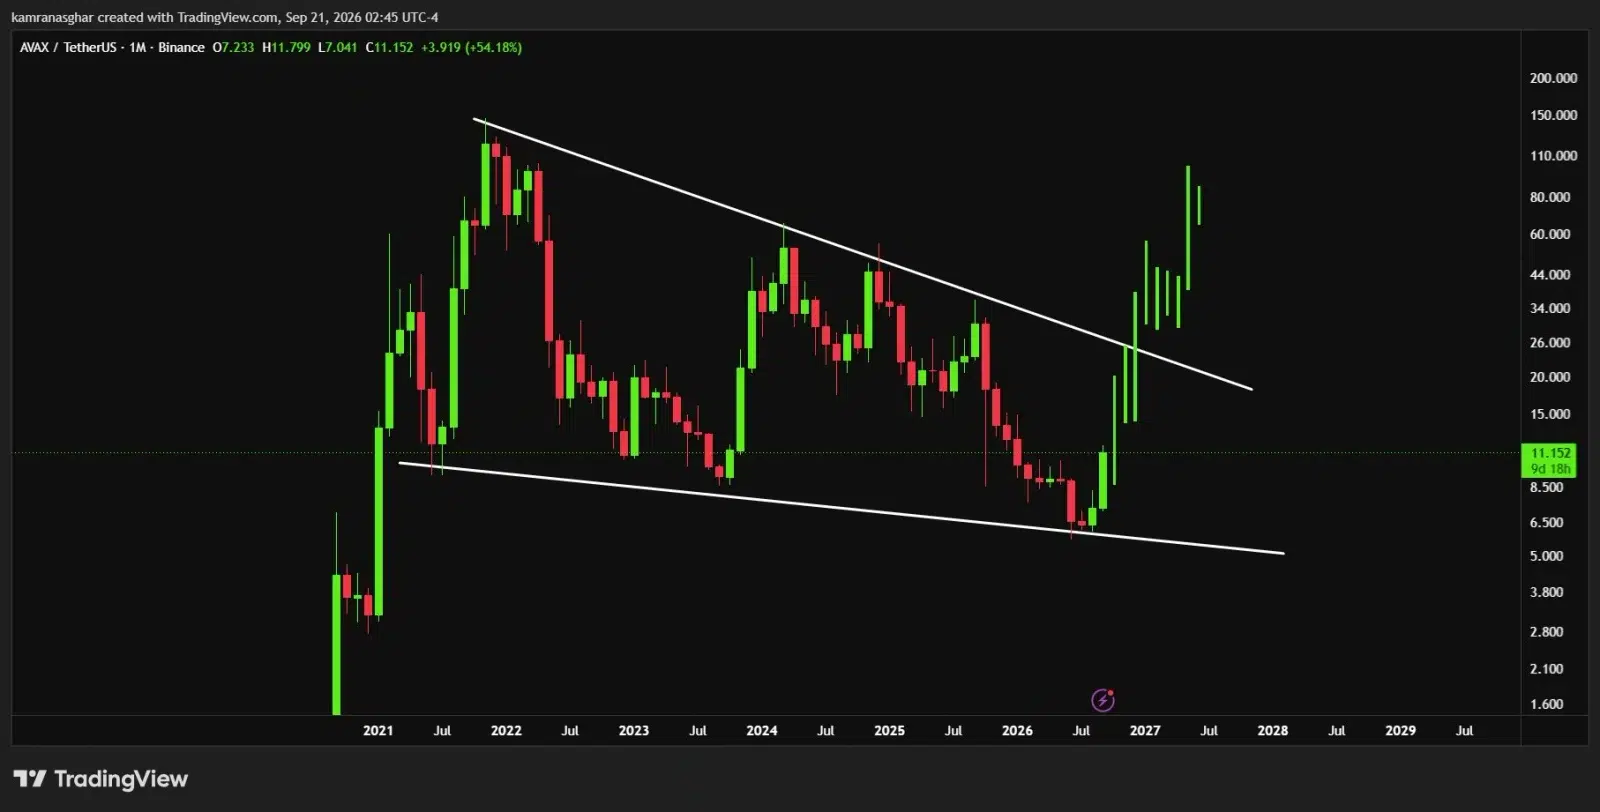
Avalanche (AVAX) is showing renewed bullish momentum after briefly losing its multi-year trendline before quickly reclaiming the level. Crypto analyst Kamran Asghar highlighted the move, suggesting the breakdown may have been a false signal.
Following the recovery, AVAX has started moving higher, with the analyst identifying $110 as a potential longer-term target.
Source: Kamran Asghar’s X Post

The trendline recovery is significant because AVAX had spent an extended period trading below major resistance levels. A temporary loss followed by an immediate reclaim can indicate that sellers failed to sustain downside pressure.
However, the setup remains dependent on continued buying interest and whether AVAX can hold its reclaimed trendline during future pullbacks.
AVAX Price Breakout Ends Extended Consolidation
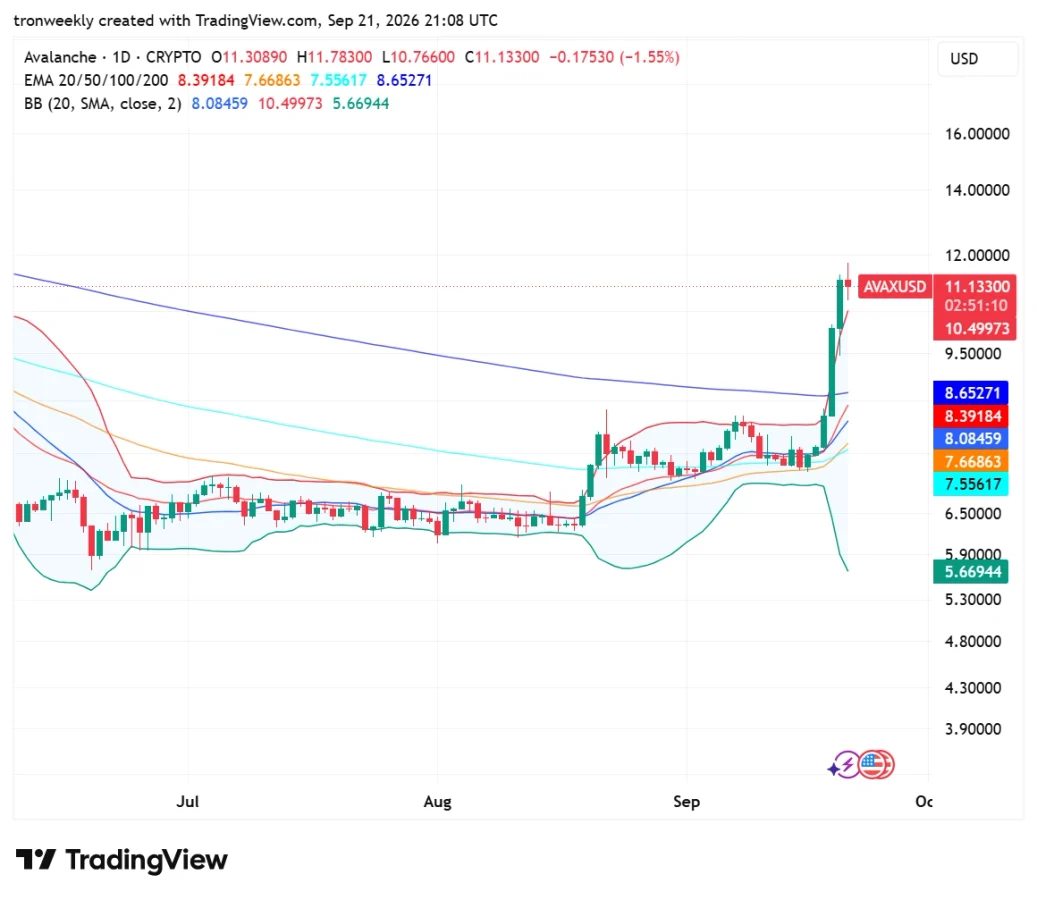
TradingView chart analysis shows that AVAX spent July and August in a prolonged consolidation phase, with price largely contained around the $7.00–$8.00 region.
During this period, Bollinger Bands tightened considerably, reflecting declining volatility. The compression eventually preceded a sharp expansion as buyers entered aggressively and pushed AVAX through established resistance.
Source: TradingView
A significant volume surge in mid-September helped AVAX break decisively above resistance and reclaim the 200 EMA positioned around $8.65.
The move continued toward a local high of $11.78, marking a substantial recovery from the previous consolidation range. This breakout also shifted the short-term structure above several important moving averages.
Also Read: AVAX Price Eyes $150 as Insomniac Partnership Boosts Avalanche Ecosystem
AVAX Price Faces Overbought Conditions
During the course of the analysis, AVAX had a value of $11.13 and continued to be above its moving averages. It shows that the trend is strong over different timeframes.
But at the same time, the price had broken above the upper Bollinger band at $10.50, which implies that the uptrend has reached overheated levels.
The last candle went down by about 1.55%, which increases the probability of some retracement before going further.
Testing the $10.50 area might become a good way to check the breakout. In case of some strong selling pressure, the 200 EMA at the $8.65 level can be considered as a deep technical level.
Derivatives Activity Signals Caution
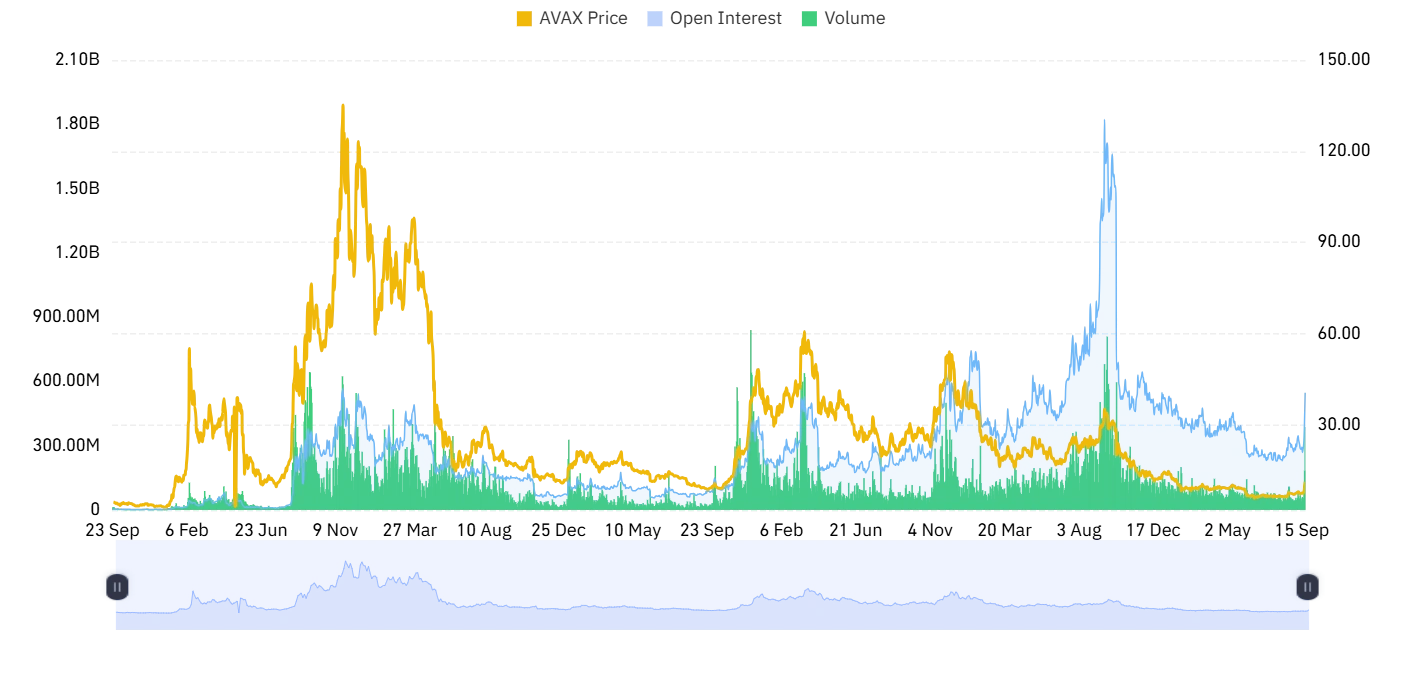
Coinglass’ data reveal a more conservative picture hidden behind AVAX’s solid spot market structure. The volume of derivatives transactions fell by 41.73% to $1.46 billion, while open interest declined by 3.39% to $525.88 million.
The concurrent decline indicates that traders have cut their derivatives exposure amid AVAX’s consolidation following its September surge.
Source: Coinglass
The reduced volume and open interest levels may point to a lower level of participation in the leveraged trades, which means that there is less upside momentum available at this stage.
While this may not mean much for the validity of the breakout in general, it shows one possible weakness of the move. The upcoming breakout by AVAX may require higher trading participation.
Avalanche Network Activity Adds Support
Apart from the price performance, the activity on the Avalanche blockchain has also served as a positive background.
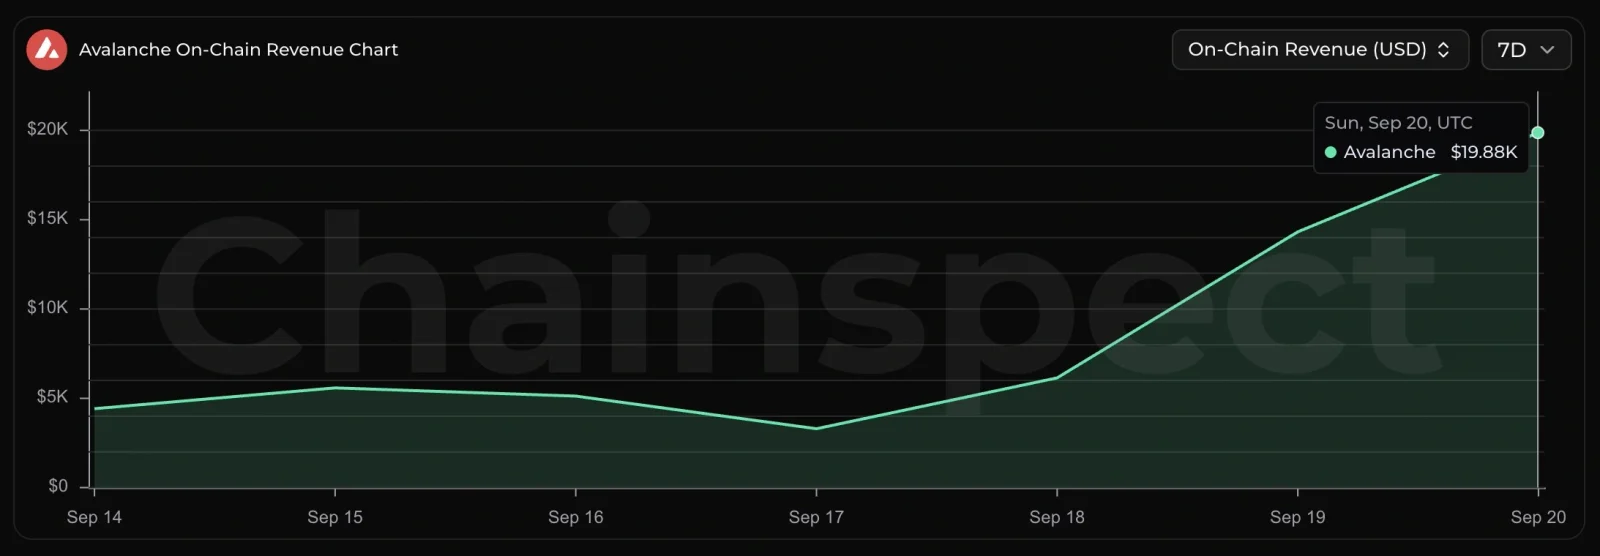
According to the data presented by Chainspect, the Avalanche blockchain earned about $20,000 in transaction fees on September 20. This has been the peak daily income for the Avalanche blockchain for the entire week.
Source: Chainspect’s X Post
Increased network fees are being seen while AVAX looks to assert its presence over important technical levels, which it previously saw.
Transaction fees alone do not dictate the trend in token prices, but network activity will add further color to the analysis of the AVAX. Alongside price and volume, this information adds another tool for market participants to analyze.
What Comes Next for AVAX Price?
This means that the current chart setup for AVAX is a combination of a retracement from the multi-year trendline, a breakout past the 200 EMA level, and network fee activity.
It is also important to note that the drop in derivatives volume and open interest implies that traders are still cautious after the swift surge.
In the event that the buyers manage to maintain their grip on the recovered trendline and support levels, the focus may eventually turn towards the resistance levels above, as suggested by Kamran Asghar, with a likely aim at reaching the level of $110. However, this is only a technical target in the long term and not an actualized one.
Also Read: AVAX Price Eyes Recovery as Ecosystem Activity Grows
This article contains market analysis and price predictions. These are not guarantees. Crypto markets are volatile. Always DYOR. Not financial advice.



Be the first to comment