



The Bitcoin price is trading in a bullish continuation pattern. If the breakout is to the upside, $90K is probably going to be the next target. Can this huge rally continue, or are the odds of a big pullback starting to increase?
Bull pennant suggests more upside
Source: TradingView

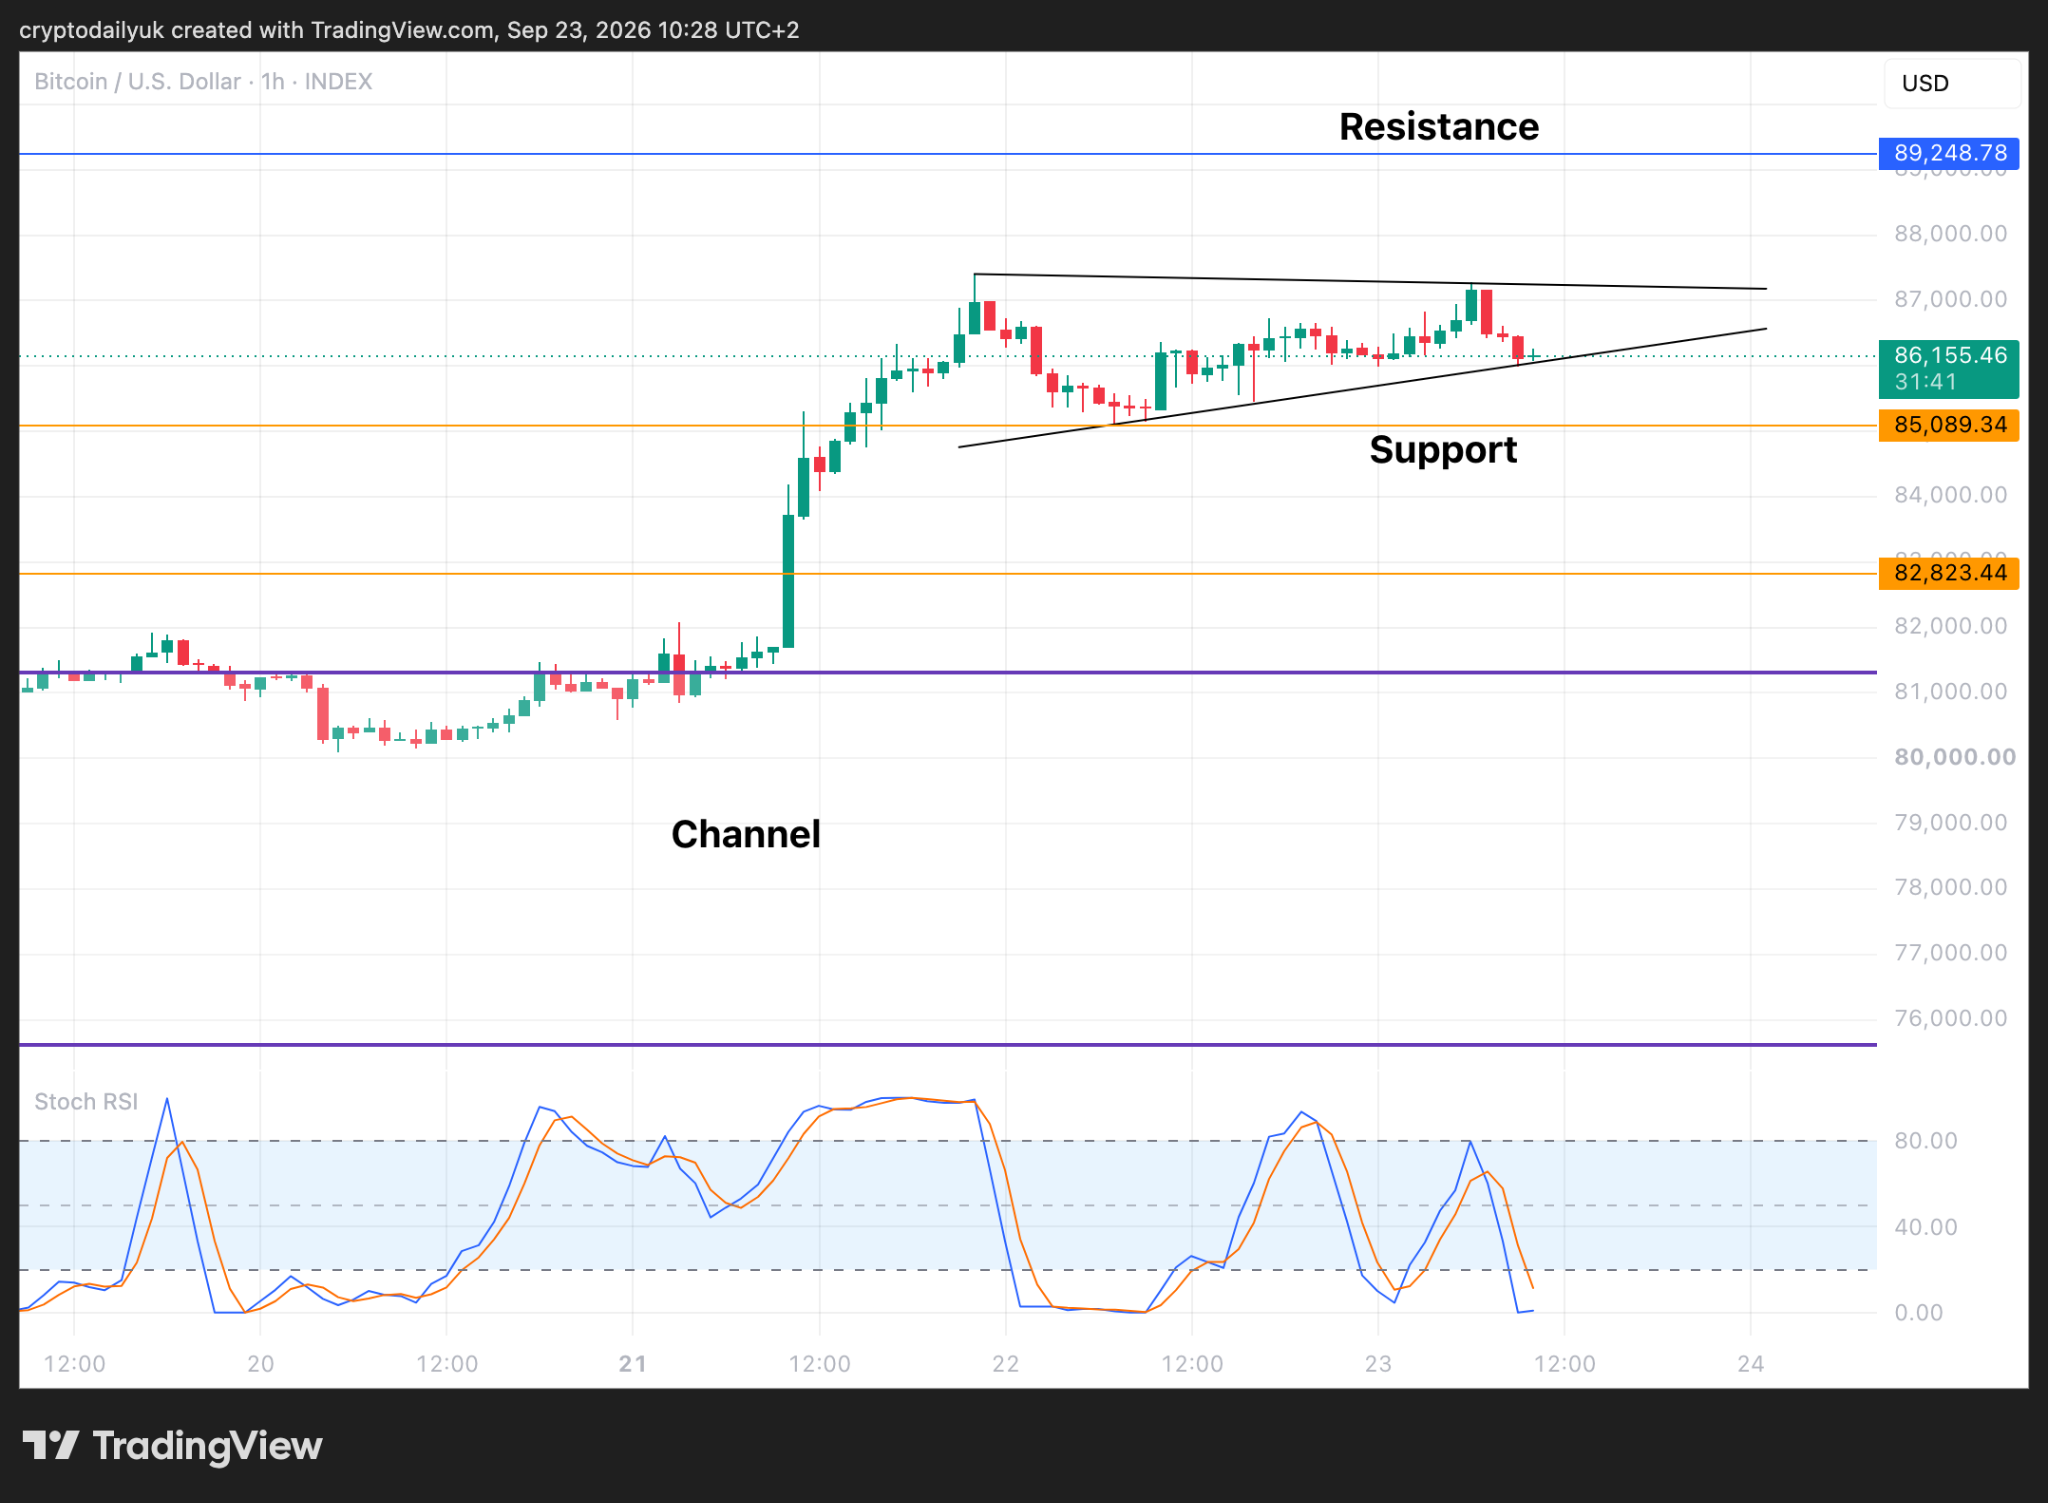
As can be seen in the 1-hour chart above, a sideways consolidation has begun again after a quickfire 7.5% surge that took the $BTC price from the top of the parallel channel at $81,300, to the current local top at $87,400 – a gain of $6,100.
The pattern we have above is a sideways consolidation after a strong rally, therefore this is a flag pattern. Given the channelling of the price into an ever smaller area, this is a pennant – at least so far. The 1-hour time frame may mean that it could still be too early to call the pattern, especially if there is a downside move which could then turn the pattern into a flag with parallel trendlines.
Be that as it may, the Stochastic RSI indicator lines are hitting the bottom of their limit and so the next move is possibly an upside one that takes the $BTC price back to the top of the pennant and a likely breakout.
Bear flags support and resistance
Source: TradingView
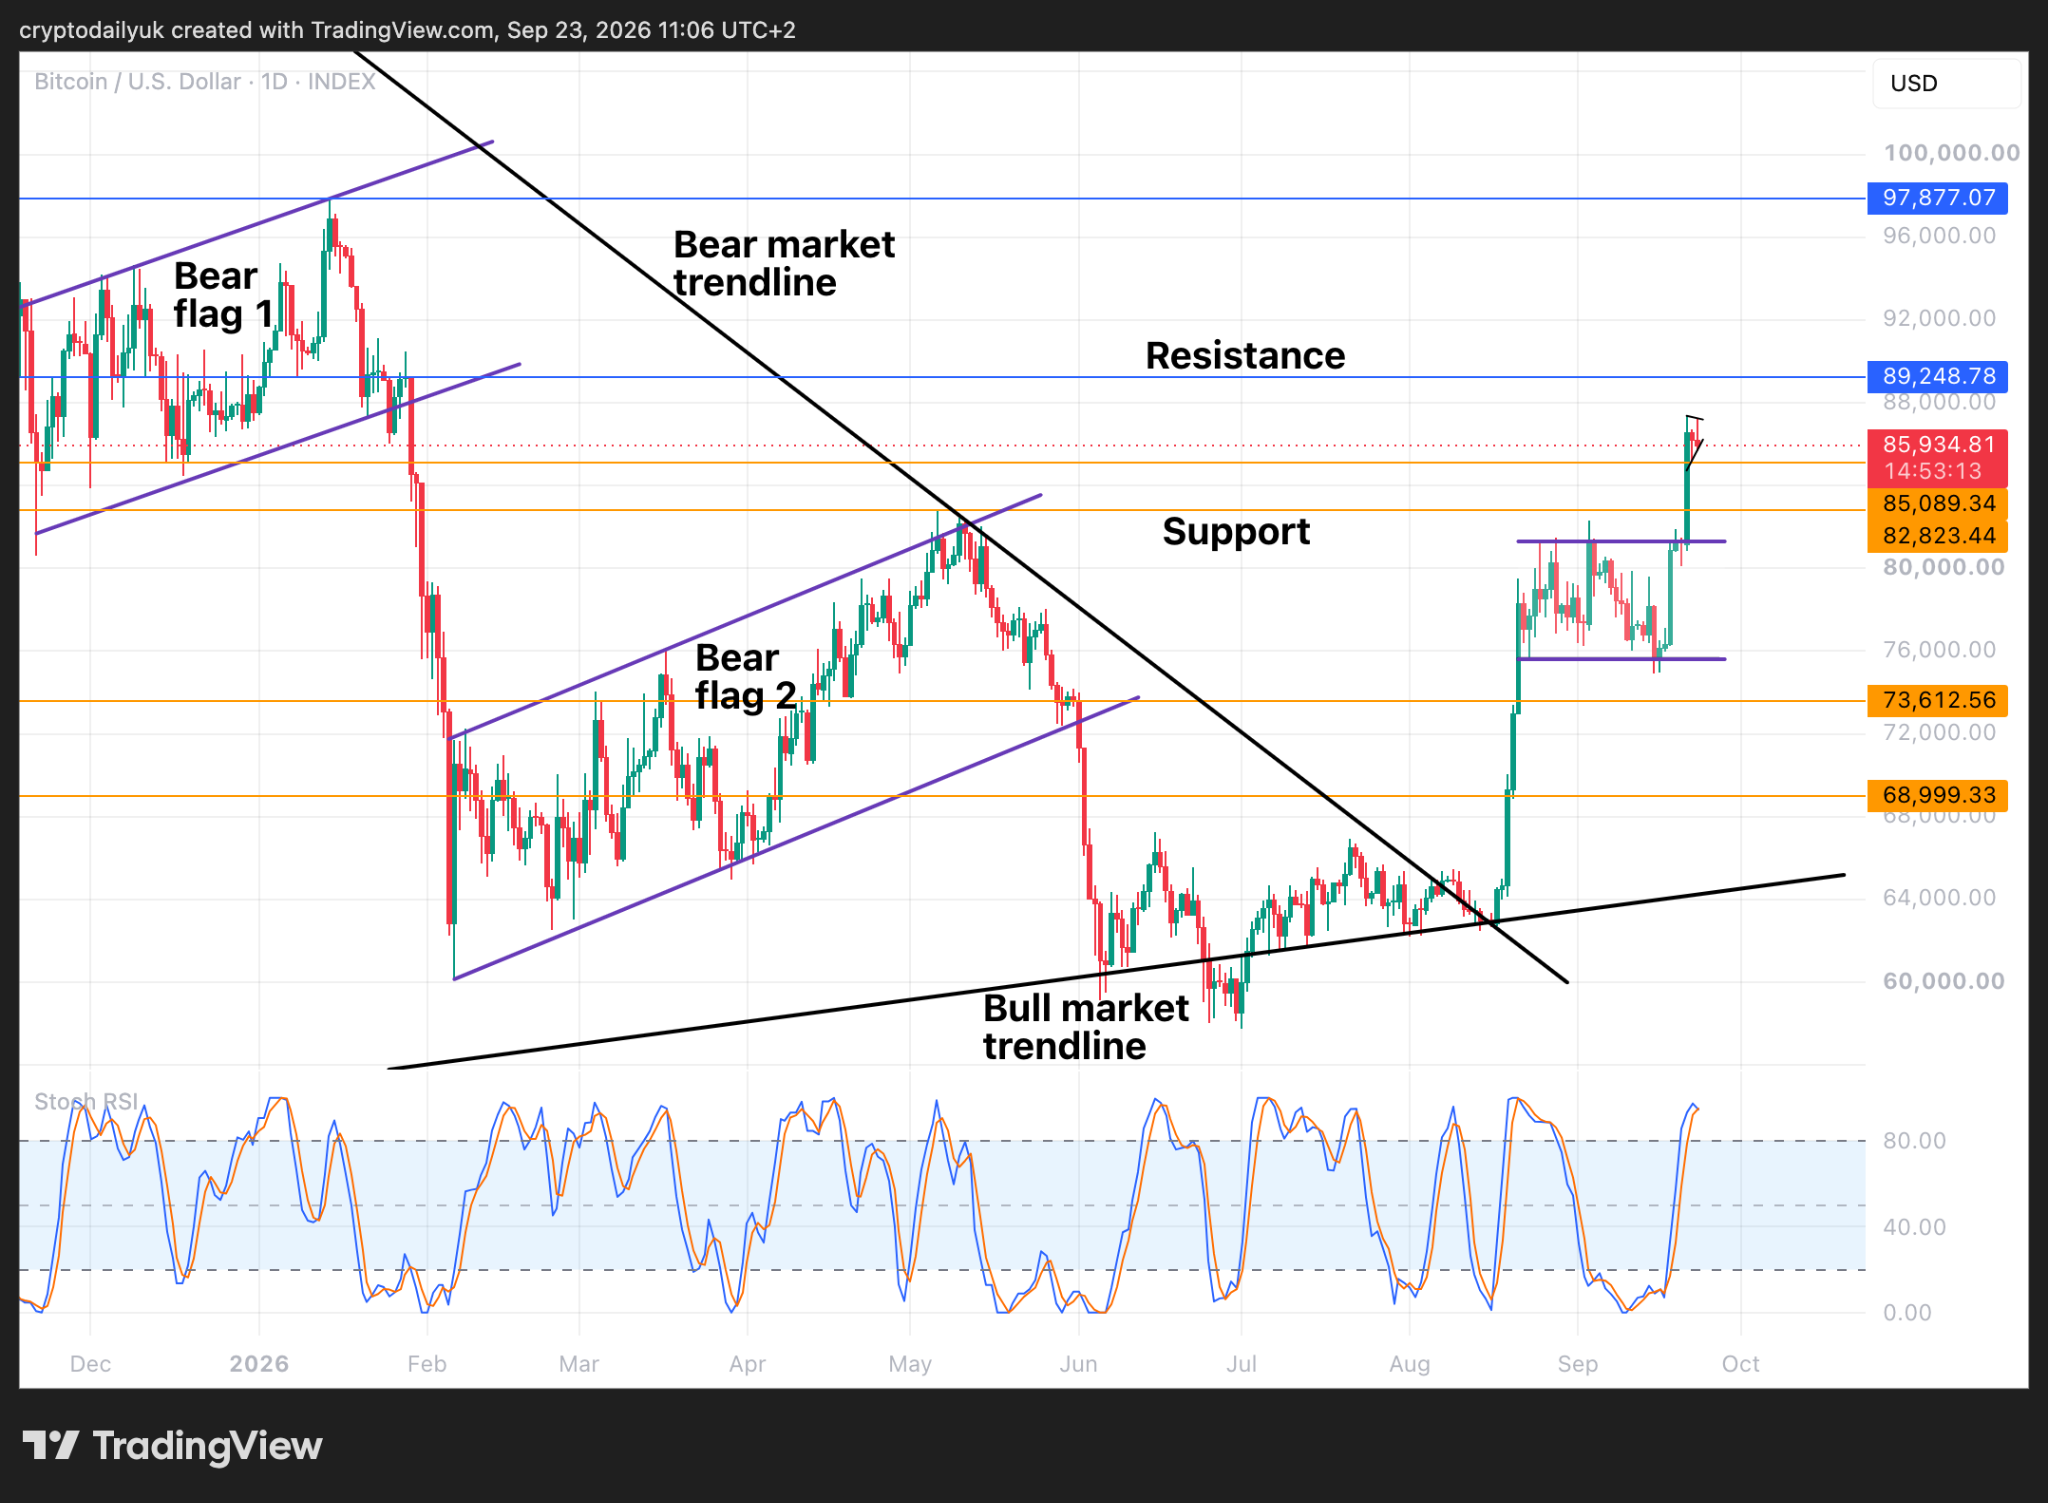
This view of the daily chart illustrates the current huge rally on the right, compared with the bear flags in the bear market on the left. These bear flags are still making their presence felt, as some strong support/resistance lines came into being as they developed.
The top of Bear flag 2 was the crucially important higher high that was recently overcome, and which goes a long way towards changing the trend back from bear to bull.
Now, what we have above the $BTC price is a resistance level at $89,250 which runs through the middle of Bear flag 1, where multiple touchpoints were either support or resistance. This is likely the next target for the bulls, unless of course the $BTC price chooses to consolidate a bit deeper and comes down to retest $85K, or even down to retest that higher high of Bear flag 2 ($82,820) in order to officially confirm it as support.
What goes up…
Source: TradingView
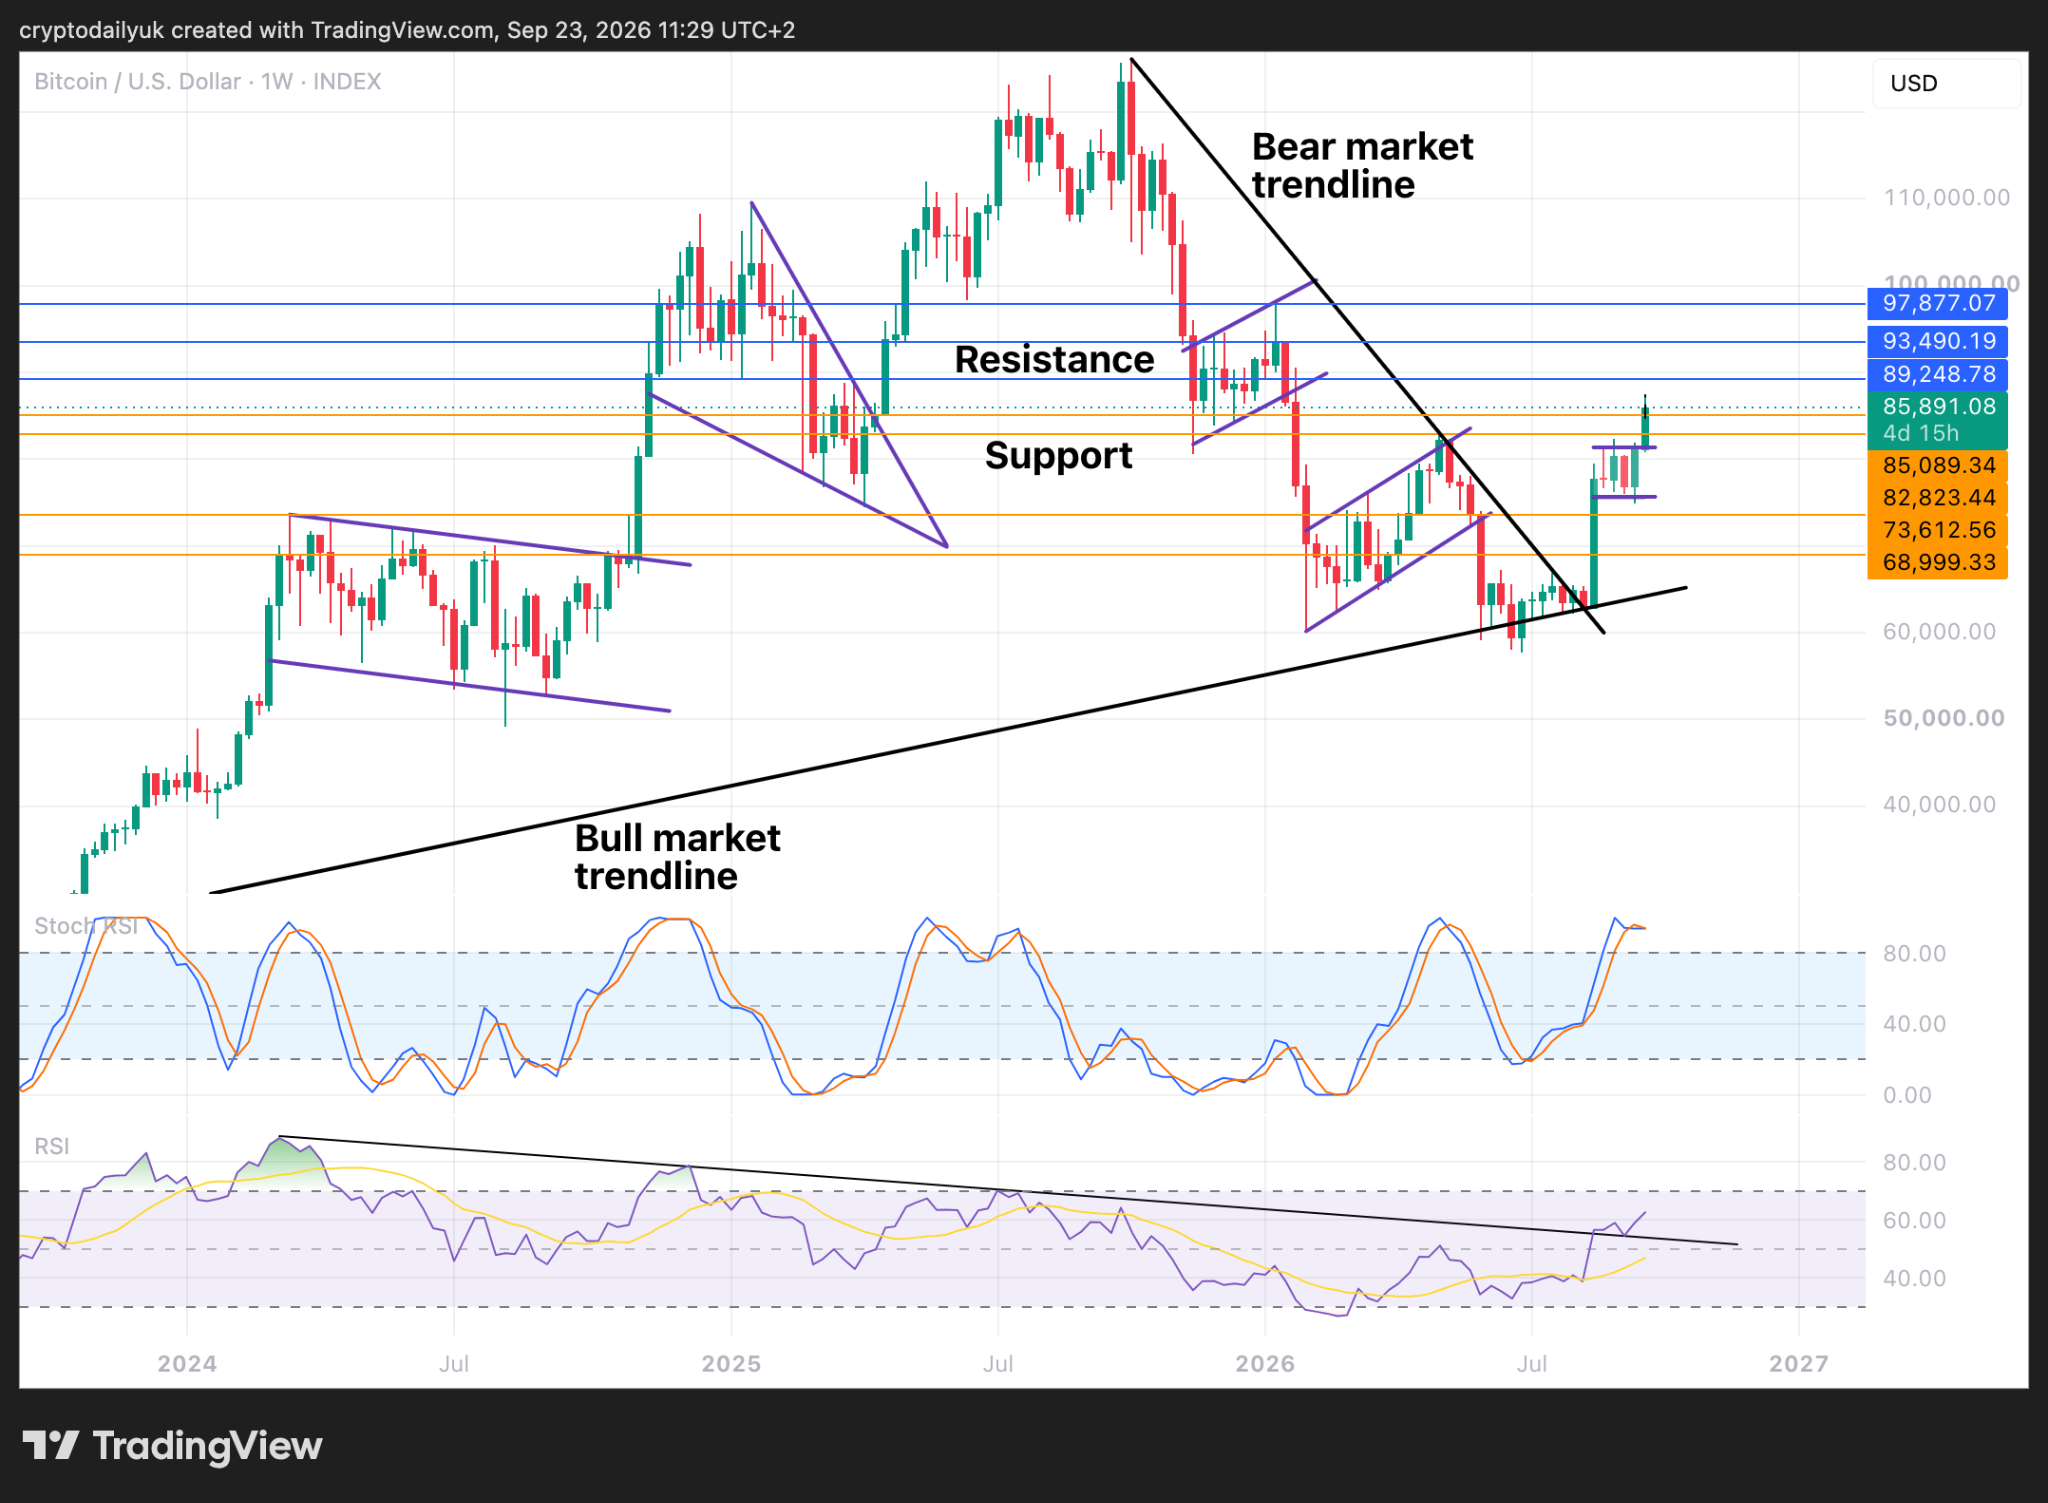
One thing to bear in mind when looking at this incredible looking rally out of the depths of the bear market, is that it cannot keep going up like this indefinitely. A temporary top is going to be found, and then a bigger and longer consolidation period is going to take place. The sharper the incline up, the longer the market will take to digest this.
It may well be that the rally is not over yet, especially given the continuation pattern that could be developing at the top of this candle, but a top will eventually be found, and this is likely to be at one of the three major resistance levels that are overhead, at either $89,250, $93,500, or $97,900. Once this top has been made, look for a considerable retracement before the upside movement can get going again.
At the bottom of the chart, the RSI reveals a very bullish setup. A two and a half year descending trendline has been broken to the upside. Look for the indicator line to also start taking out the previous higher highs. If we are in a bull market now, the indicator line would not be expected to come back and dip below the trendline.
Disclaimer: This article is provided for informational purposes only. It is not offered or intended to be used as legal, tax, investment, financial, or other advice.





Be the first to comment