


Pi Network price has fallen back below $0.09 on September 24 after its latest recovery failed near $0.093, leaving PI below its main daily moving averages as short term momentum weakened.
Summary
- PI has fallen below $0.09 after its latest recovery stalled near $0.093.
- Price remains below the 20, 50, 100 and 200 day EMAs, while daily MACD remains negative.
- A break below $0.085 could put the $0.080 to $0.082 support region back in focus.
- PI needs to reclaim $0.0898 and $0.0920 before the short term technical picture improves.
According to the PI/USDT charts, Pi Network was trading near $0.0878 at the time of writing, after opening the daily session around $0.0881 and falling as low as $0.08765. The pullback followed an attempt to recover above $0.09 earlier this week, but buyers were unable to keep the token above that level.

PI had already shown signs of losing momentum a day earlier. As crypto.news previously reported, the token reached $0.0926 on Sept. 23 before dropping back toward $0.088. The 50 day and 100 day moving averages were acting as overhead barriers during the move.
Recent Pi Network developments have been more positive on the network side. More than 417,000 users were cleared to continue KYC, while Protocol V27 progressed through testing. The price response has remained limited despite those updates.
Why is Pi Network price going down today?
PI’s latest decline comes after buyers failed to turn the recent move above $0.09 into a sustained breakout.
The daily chart shows PI trading below its 20, 50, 100 and 200 day exponential moving averages. The 20 day EMA currently sits around $0.08979, followed by the 50 day EMA at $0.09204.
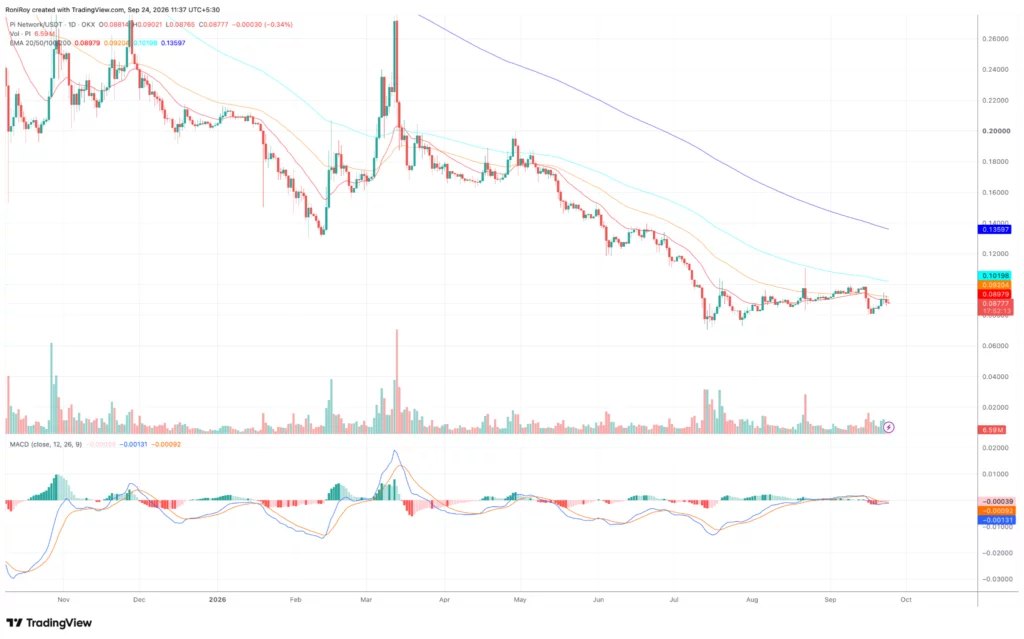
Higher up, the 100 day EMA stands near $0.10198, while the 200 day EMA remains much further away at approximately $0.13597.
All four averages are arranged in bearish order, with the shorter term averages below the longer term ones. Price has spent most of September trying to build a base below the 20 and 50 day averages but has yet to hold above either.
Selling pressure returned after PI approached the same resistance area this week. The token’s failure around $0.092 is notable because traders were watching a similar zone during August. PI tested the $0.095 to $0.102 area during its August recovery but could not turn that move into a lasting breakout.
Daily MACD has weakened again following the latest rejection. The MACD line sits near minus 0.00131, below the signal line at roughly minus 0.00092, while the histogram has moved negative to around minus 0.00039.
Both MACD lines remain below the zero line. Momentum is considerably less negative than during PI’s June and July selloffs, but the indicator does not yet show enough buying pressure to confirm a trend reversal.
Pi Network upgrades have yet to translate into stronger demand
Price weakness has continued even as Pi Network works through several technical and user onboarding changes.
The Pi Core Team recently refined checks for accounts that had been flagged as possible duplicates, allowing more than 417,000 users to resume the KYC process. Another roughly 497,000 Fast Track wallets had been unable to claim migrated PI because they lacked the gas funds required for the transaction.
Protocol V27, meanwhile, moved to Testnet 2 after processing roughly 250 transactions per block. Earlier work around Protocol 27 infrastructure included smart contract authentication, automated market maker functions and RPC infrastructure.
PI has struggled to turn those developments into sustained buying demand. During an August rally, the token gained more than 10% and trading volume rose as Protocol 26 approached, yet the $0.0882 to $0.09 region was already acting as resistance.
Supply remains another factor hanging over the market. Roughly 1.21 billion PI tokens are scheduled to unlock during 2026, according to earlier estimates, while mainnet migration can turn previously inaccessible balances into transferable tokens.
A previous analysis of Pi Network’s 2026 token unlocks estimated the release pace at around 6.5 million PI per day. Actual selling depends on whether holders move newly available tokens to exchanges, so migration does not mean those tokens will automatically enter the market.
PI price risks another test of $0.08
The four hour chart shows the recent recovery losing momentum without confirming a strong new downtrend yet.
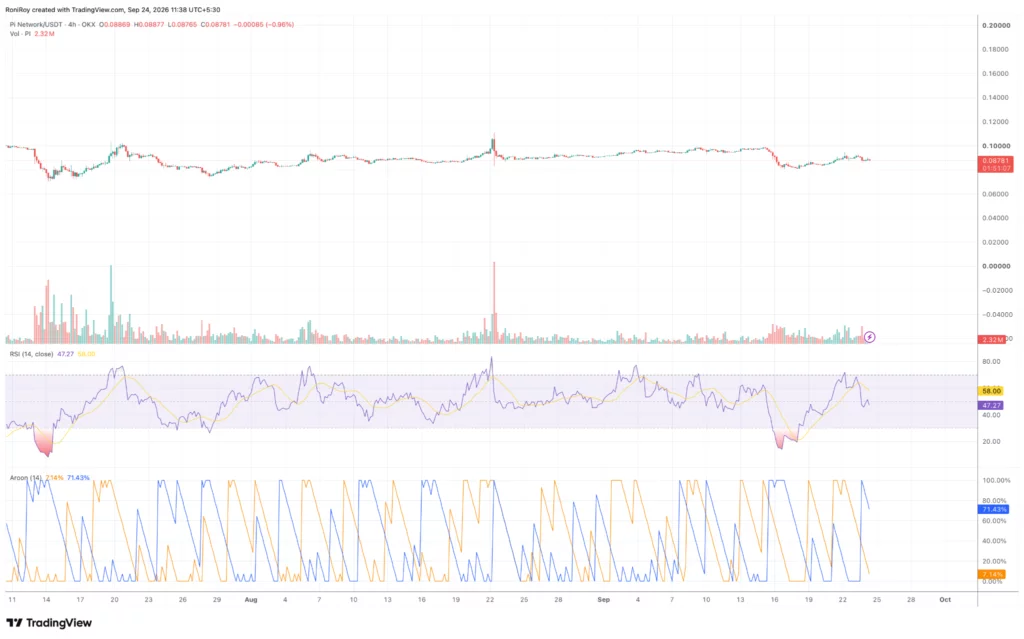
PI’s 14 period relative strength index has dropped to 47.27, down from above 70 during the Sept. 22 recovery. Its RSI moving average remains considerably higher at around 58.
An RSI reading below 50 gives sellers a slight momentum advantage, although PI is nowhere near oversold territory. A move below 40 would provide stronger evidence that selling momentum is building, particularly if price breaks its recent local lows at the same time.
Aroon paints a less bearish short term picture. Aroon Up remains around 71.43%, while Aroon Down sits at only 7.14%. The reading shows that the latest meaningful high remains more recent than the latest significant low, meaning the indicator has not yet confirmed a fresh four hour downtrend.
Immediate support sits around $0.085 to $0.087. PI has repeatedly traded around this region since its mid September decline, making a clean break below it the next technical test.
Failure to hold $0.085 could put the $0.080 to $0.082 region back in play. A larger selloff would leave the July price area around $0.071 to $0.075 as the next lower zone visible on the daily chart.
Buyers first need to reclaim the 20 day EMA around $0.0898. The 50 day EMA near $0.0920 forms the next hurdle, followed by the $0.096 to $0.10 region.
A move through those levels would bring the 100 day EMA near $0.102 into focus. Until then, PI remains below every major daily EMA while MACD stays negative and four hour RSI sits below 50, leaving $0.085 as the key level separating the current consolidation from another possible test of $0.08.


Be the first to comment