


What to know:
- Tron Inc. raised TRX holdings to 688.8M+ tokens, reinforcing its accumulation strategy.
- Bollinger Bands tightening near $0.32 hint at a possible breakout toward $0.35.
- MACD and RSI signals suggest weakening bearish pressure and sustained buying strength.

Tron Inc. (NASDAQ: TRON) expanded its digital asset treasury by acquiring 160,309 TRX, at an average price of $0.3119, continuing its steady accumulation strategy.
The latest purchase raises its total TRX holdings to more than 688.8 million tokens, reinforcing its growing position as a major corporate holder within the TRON ecosystem
.

Source: TRONSCAN
The company stated that it intends to further expand its Tron DAT holdings as part of a broader treasury strategy focused on long-term value creation for shareholders.
This approach reflects increasing corporate interest in blockchain reserves and aims to strengthen balance sheet resilience through continued TRX accumulation and ecosystem participation over the long term.
Also Read: TRON (TRX) Price Holds Above EMA Support After Tron Inc Treasury Expansion
TRX Technical Outlook shows Potential Recovery
According to TradingView, TRX has a bullish momentum indicated by the price trading at $0.31772, a 2.12% increase in price over the last day. Since the dip to $0.268 in February, the price has been rising steadily.
The price remains above the 20-day EMA at $0.304 and the 50-day EMA at $0.296, a vital short-term trend. This indicates that the current price is controlled by the buyers.
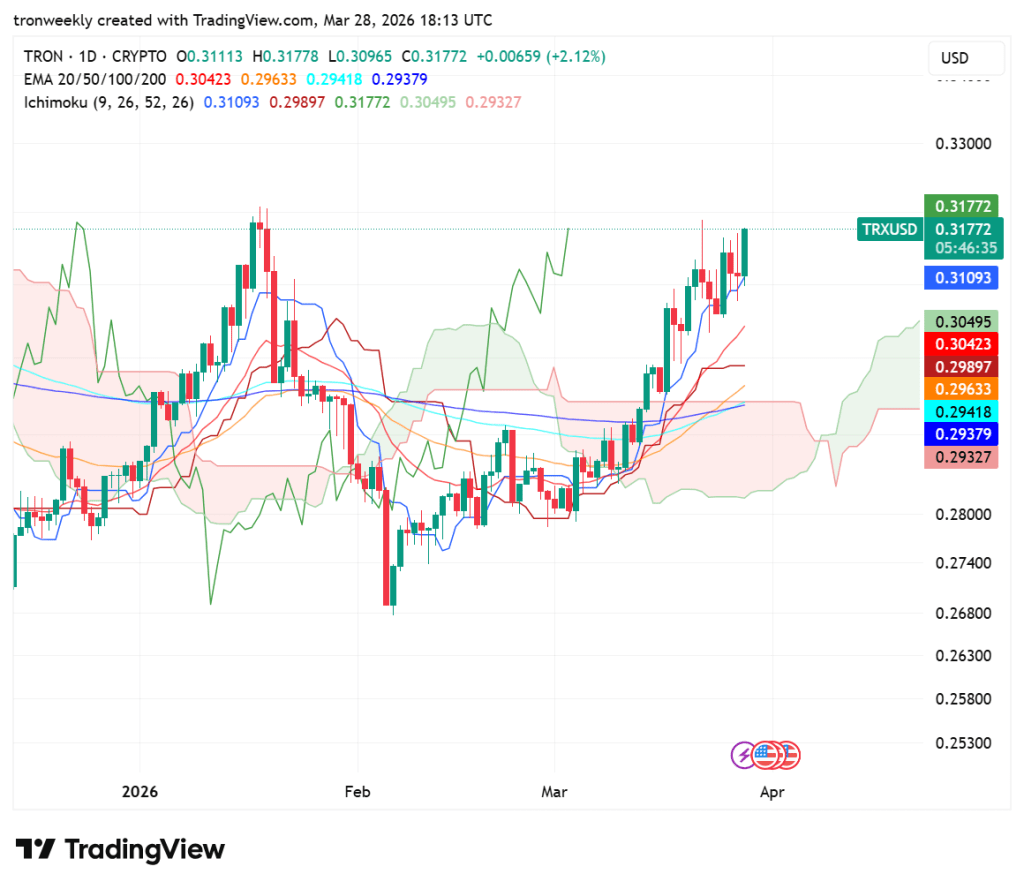
Source: TradingView
The Ichimoku Cloud is signaling a bullish move as the price is breaking through the Kumo and possibly indicating a trend reversal.
The Leading Span is also changing to green, supporting the move to $0.330. The support for the price is the $0.310 Kijun-sen. As long as TRX is trading above the support floor, the price is more likely to move higher.
Momentum Indicators Turn Strongly Bullish
The Relative Strength Index is currently at 68.53 and is slowly moving towards the overbought zone, which is 70.
This is a strong bullish indicator as the RSI is moving upwards while remaining above the yellow signal line, which is currently at 65.91. The buyers remain in control, and the price is moving steadily towards the $0.32 price zone.
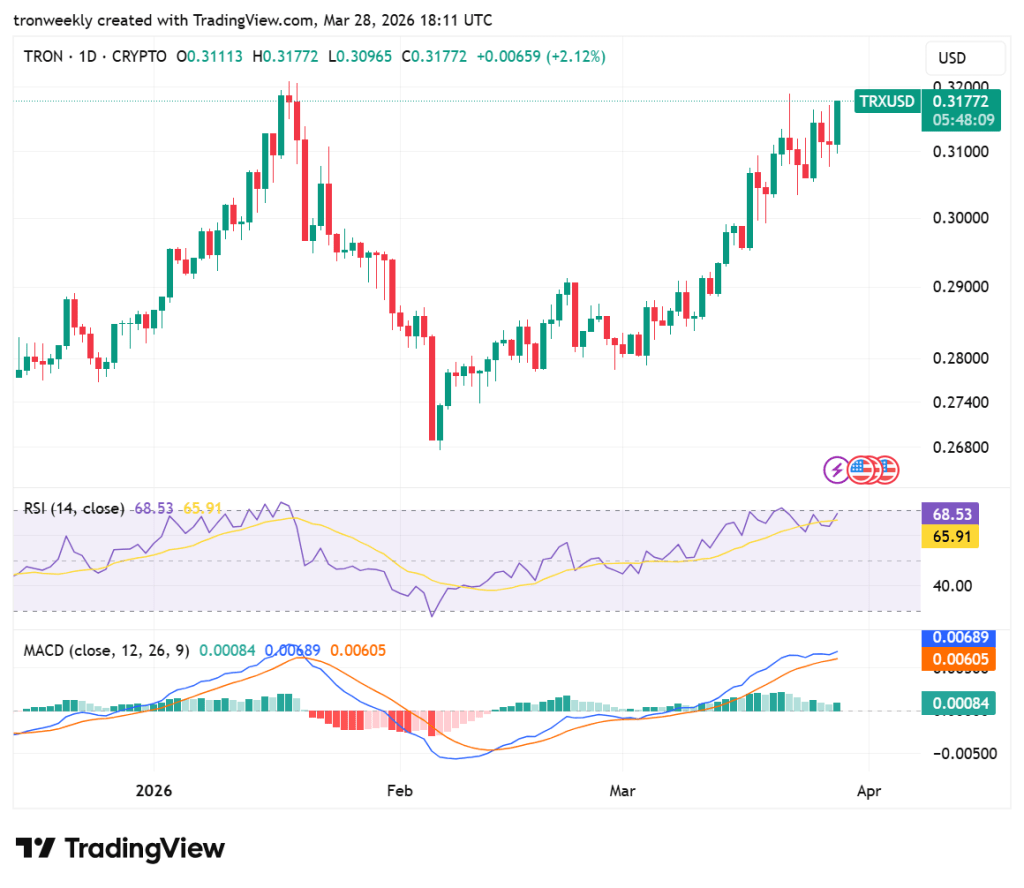
Source: TradingView
The MACD line remains at 0.00689, continuing to stay above the signal line at 0.00605 to maintain a bullish crossover. The green histogram bars are at 0.00084, and the pace of the trend does not appear to be erratic.
The distance between the moving averages also suggests that the asset has continued strength and provides a cushion for the price to rise higher.
This article contains market analysis and price predictions. These are not guarantees. Crypto markets are volatile. Always DYOR. Not financial advice.
Also Read: Tron Inc. Expands Digital Asset Treasury as TRX Poised for $0.40 Break

Be the first to comment