



XRP price has returned to a key resistance area after quickly recovering from a recent rejection around $1.50. The rebound has brought the cryptocurrency back into focus as buyers attempt to push through a resistance zone that has previously limited its advance. Technical analysts are now watching whether XRP can sustain its recovery and establish a decisive move above the barrier.
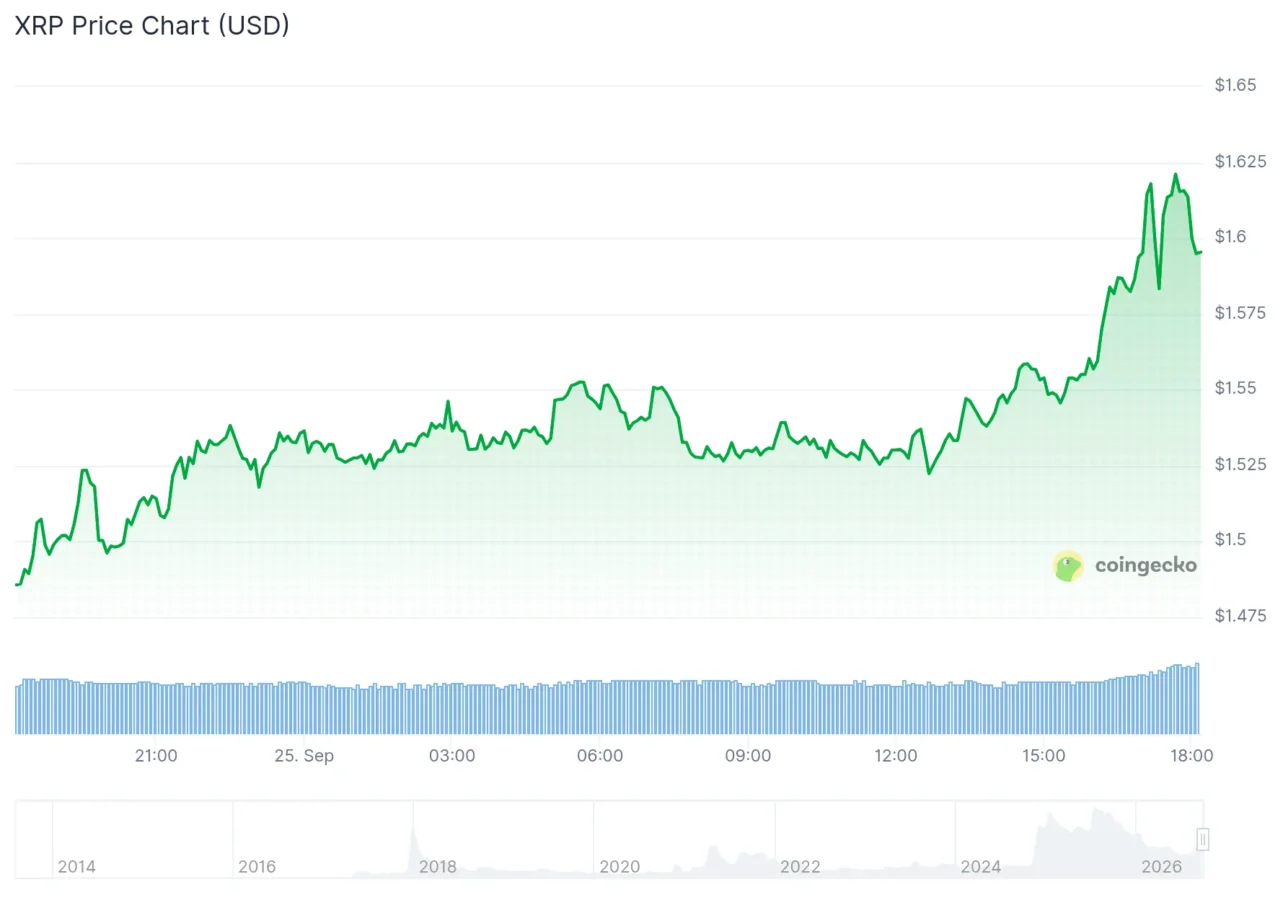
At the time of the latest market data provided, XRP price was $1.60, up 5.20% over 24 hours, with daily trading volume of $8.07 billion. Its market capitalization stood at $100.61 billion, while XRP accounted for 3.48% of the total crypto market. Market data also shows that XRP has recently experienced sharp daily swings as it moved from around $1.30 earlier in September toward the current resistance area.
Also Read | Interac vs USDT on TRON: Why a Canadian Casino Payout Takes Minutes or Days
XRP Reclaims Key Support Level
Market analyst Diana mentioned that XRP managed to get back to the $1.50 mark after rejection. As per her analysis, this move brought XRP back to around $1.54 at the time of her post and made XRP move towards the $1.60 – $1.61 resistance mark.

She emphasized the four-hour time frame as crucial for the current scenario. She mentioned that XRP has taken back the $1.50 mark and is holding above its critical moving averages. In addition, she indicated that the RSI is close to the level of 57, and it indicates momentum recovery, but not in the traditional overbought zone.
The move is crucial for XRP since it has been showing high volatility around this resistance mark. Market data proves that XRP went up fast from below $1.30 in September to above $1.50. Besides, the daily high was reached on September 23 at $1.65.
Whale Accumulation Adds Market Context
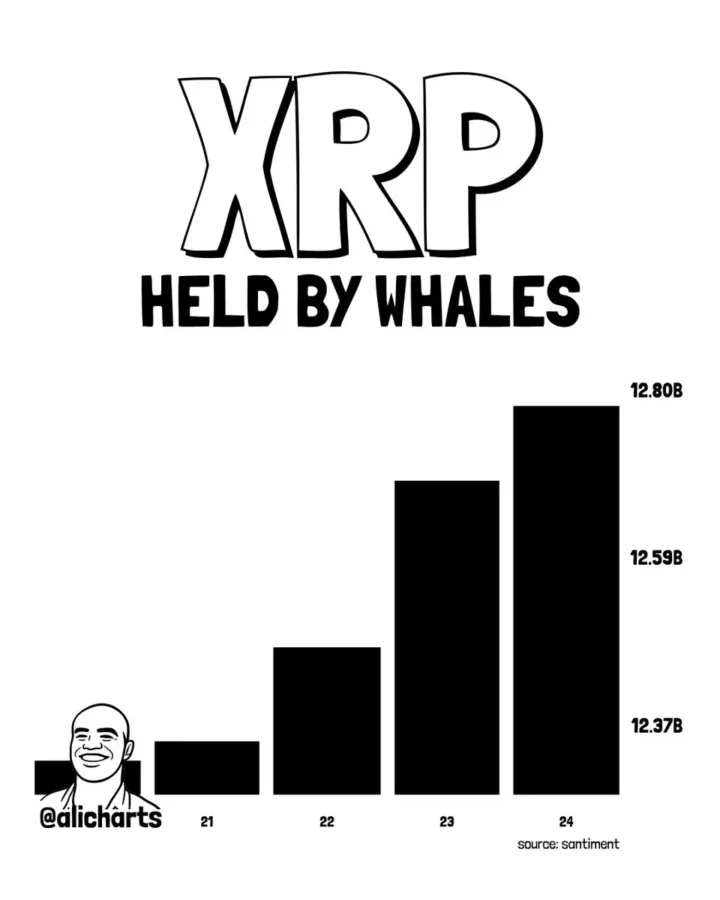
According to a recent post by Ali Charts, there was another level of analysis, which stated that the XRP whales gathered more than 470 million XRP within five days. The total value of the purchases was estimated at $724 million, and the accumulation was linked to an inverse head-and-shoulders pattern forming on the daily chart of XRP.
Whale activity might become a source of interest since a considerable volume movement could correlate with changes in the demand for the asset. In contrast, another rejection could send XRP back toward its nearby support areas before another attempt at resistance.
The distinction between briefly moving above resistance and securing a sustained close is particularly important. Previous price action shows that XRP can move sharply through key levels before reversing, making confirmation important for assessing whether the latest recovery represents a lasting structural change.
XRP Price Faces Resistance Between $1.58–$1.62
XRP’s technical formation by Ali Charts shows that the cryptocurrency exists in a wider resistance zone of about $1.58-$1.62. The trader warned that rejection from this level could trigger a retracement, with the first level of support seen at $1.46 and a second one at $1.32.
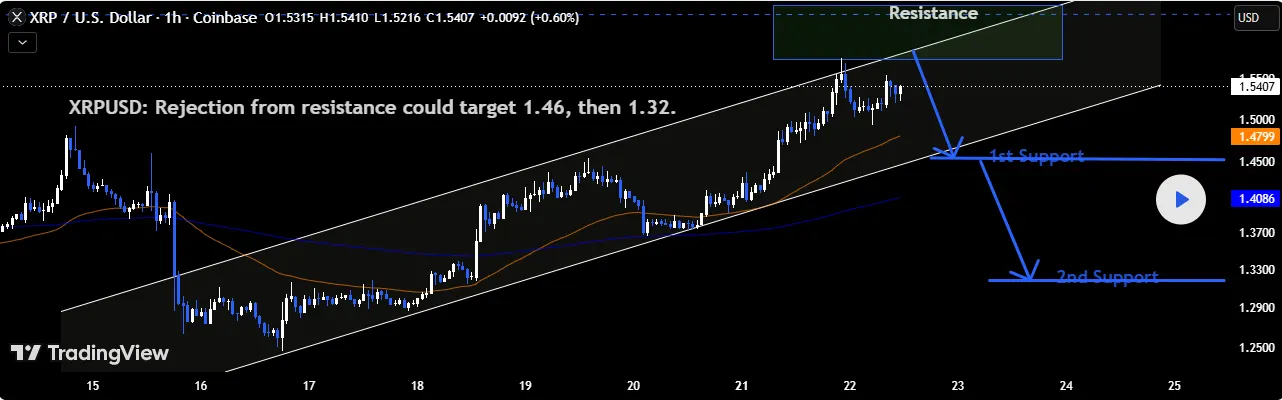
Two scenarios are thus presented for the price of XRP. Breaking above the resistance zone would help to further solidify the breakout pattern and bring focus towards higher levels, while rejecting the level again would push XRP back to its support levels before challenging its resistance again.
The importance of the difference between crossing the resistance level temporarily and closing above is thus critical. Past price action shows that XRP is able to spike through important levels before reversing direction.
What Happens Next for XRP Price?
The next challenge for XRP price is to determine how much buyers will be able to exert pressure above the $1.60-$1.61 level. The technical analysis done by Diana includes a possible price movement towards the $1.70 level if XRP manages to break the resistance, while Ali Charts is looking at the larger $1.58-$1.62 region and the emerging chart formation on the daily chart.
For more technical validation of the bullish setup, the cryptocurrency must continue to trade above the resistance level after managing to break above it, rather than dropping back below the region again. In case of a rejection of the bullish movement, it will put back into focus the support levels of $1.46 and $1.32.
A bullish whale accumulation, an inverse head and shoulders formation, and the recovery above the $1.50 level make the present setup an interesting one. However, the resistance region remains the near-term obstacle, and the upcoming price response will define the future path.
Also Read | LINK Price Eyes Breakout Toward $15 as Network Activity Signals Momentum
This article contains market analysis and price predictions. These are not guarantees. Crypto markets are volatile. Always DYOR. Not financial advice.



Be the first to comment