


What to know:
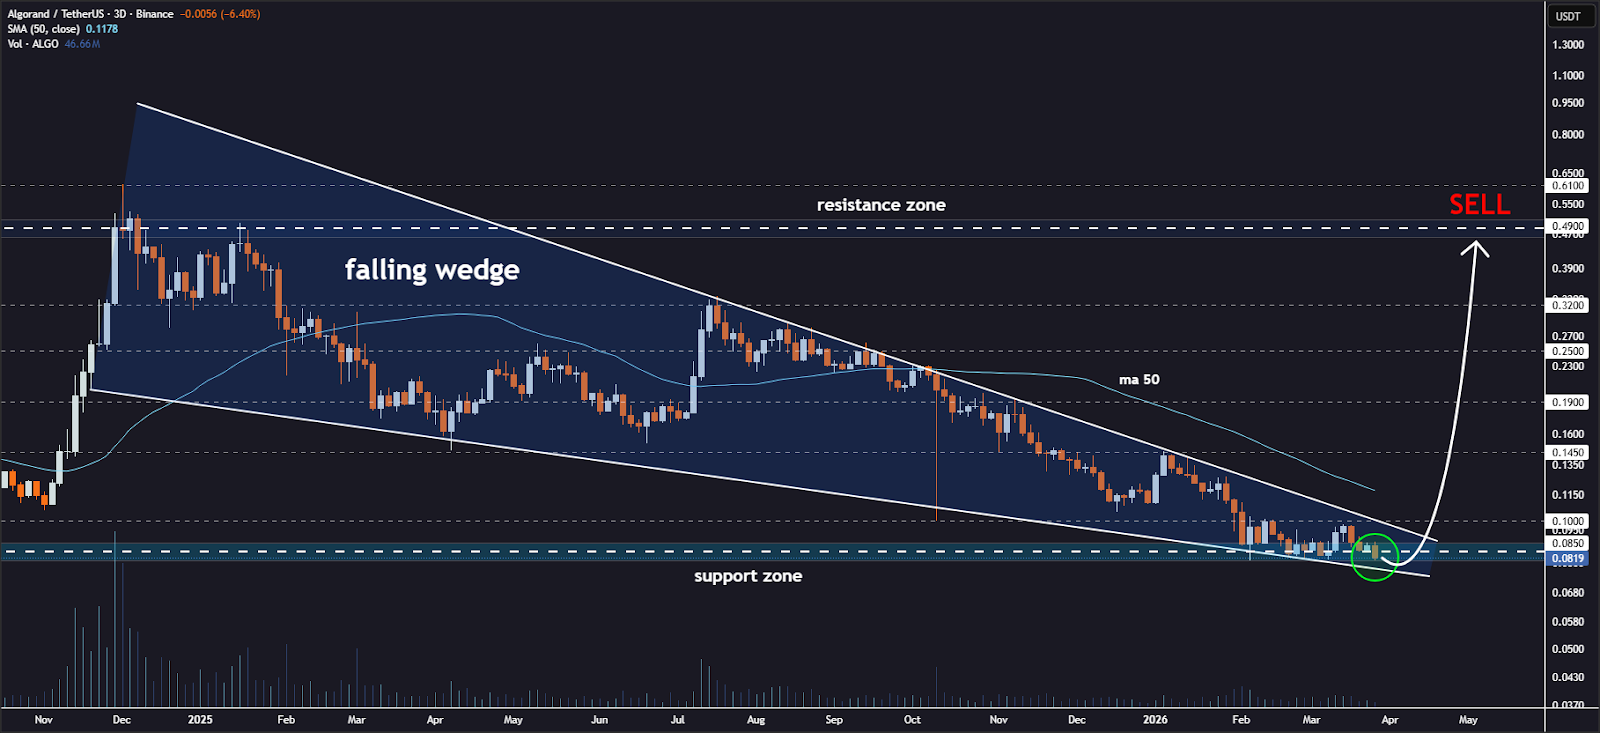
- ALGO is consolidating in a falling wedge, a pattern often linked to potential bullish reversal setups.
- RSI and MACD show early recovery signals, suggesting weakening bearish momentum.
- A breakout above resistance could trigger upside targets ranging from $0.100 to $0.490.

Algorand (ALGO) is currently consolidating inside a falling wedge pattern on the 3-day timeframe, a structure often linked with potential bullish reversals after extended downtrends.
According to the crypto analyst Jonathan Carter, the price action is compressing toward the lower boundary, where support continues to hold. Early signs suggest weakening bearish momentum and gradual stabilization as buyers begin absorbing selling pressure.
Source: Jonathan Carter’s X Post

If a breakout occurs, ALGO could enter a staged recovery phase with potential upside targets at $0.100, $0.145, $0.190, $0.250, $0.320, and $0.490.
A confirmed move above resistance with rising volume would strengthen bullish continuation prospects, while failure to hold support may invalidate the setup and extend consolidation or downside pressure.
Also Read: Algorand Price Analysis: Can ALGO Recover Toward $0.1685 After Breakdown?
Algorand (ALGO) Faces Pressure Below Major Moving Averages
According to TradingView, ALGO has a clear long-term bearish trend with a series of lower highs and lower lows.
This is supported by the Exponential Moving Averages (EMAs), where the 20-period EMA is at $0.08351 and the 50-period EMA is at $0.08562. These are well above the current level of the asset and are a major resistance point for the asset.

Source: TradingView
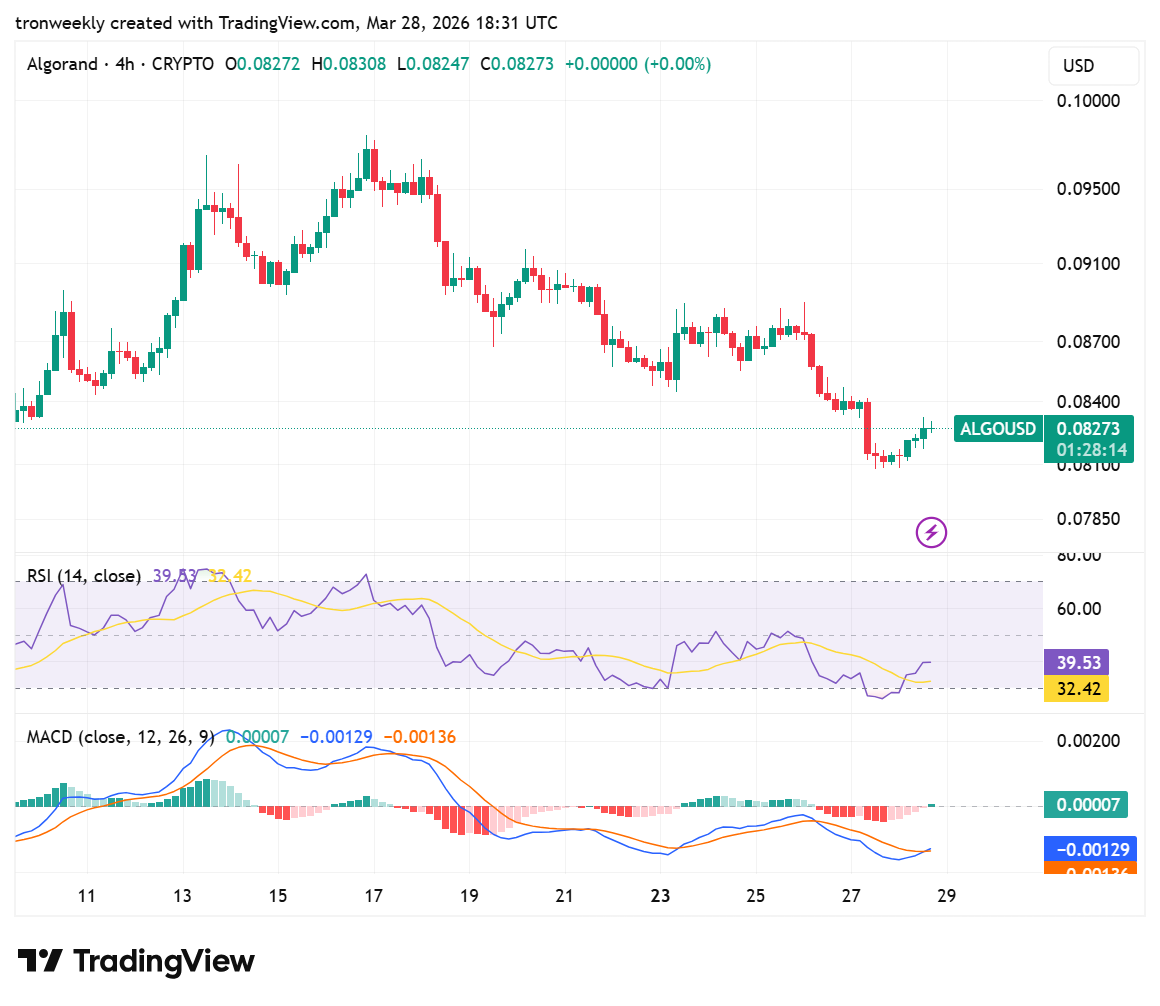
From the recent price action, it is evident that the price of ALGO is stabilizing around the lower Bollinger Band at $0.07945 after a sharp fall. Although there is a minor relief rally at $0.08267, the price action is fragile.
It is important to note that the Bollinger Basis of $0.08381 needs to be watched; otherwise, the price could fall back to the $0.08000$ level.
Momentum Indicators Point to Improving Strength
The Relative Strength Index (RSI) is currently trading at 39.53 after bouncing back from the oversold zone of 32.42. This is a positive indication of the resumption of buying interest as the RSI approaches the 50 levels.
However, the RSI is still trading below the 50 levels, indicating that the bearish momentum is still in control of the current short-term trend.

Source: TradingView
Meanwhile, the MACD indicator reveals a bullish crossover, as the blue line moves above the orange signal line. The crossover is seen in the change in the color of the histogram, which changes from red to green.
The change in color reveals the weakening of the selling pressure. Nevertheless, the two lines remain below the zero level.
This article contains market analysis and price predictions. These are not guarantees. Crypto markets are volatile. Always DYOR. Not financial advice.
Also Read: Algorand (ALGO) Falling Wedge Suggests Potential Rally Toward $0.49

Be the first to comment