



What Happened to the Ethereum Price This Week?
Ethereum had a strong start to the week and a quieter end. $ETH ran from around $2,575 on September 20 to a weekly high near $2,800 on September 22, then gave back half of that gain and settled into a range between $2,650 and $2,700. It is currently trading at about $2,687.
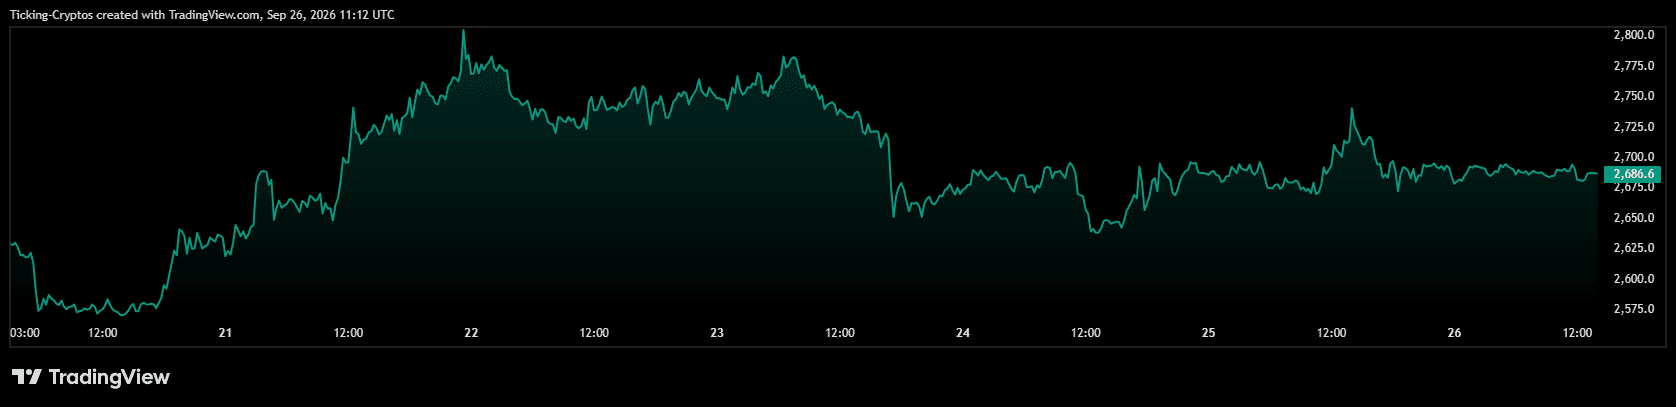
The rejection at $2,800 was sharp, but the pullback stopped well above the $2,600 level that has held since the breakout. Sellers took profit, buyers absorbed it, and the price has been grinding sideways ever since.
Ethereum Price Analysis: Is Ethereum Coin Bullish??
Zoom out and the picture is clearly bullish. Ethereum broke out of its summer range at the start of September, jumped from below $2,000 to above $2,400 in a matter of days, and has since climbed further to $2,600 and beyond. The 200-day EMA at $2,250 is far below the price and now rising, which confirms the trend change.
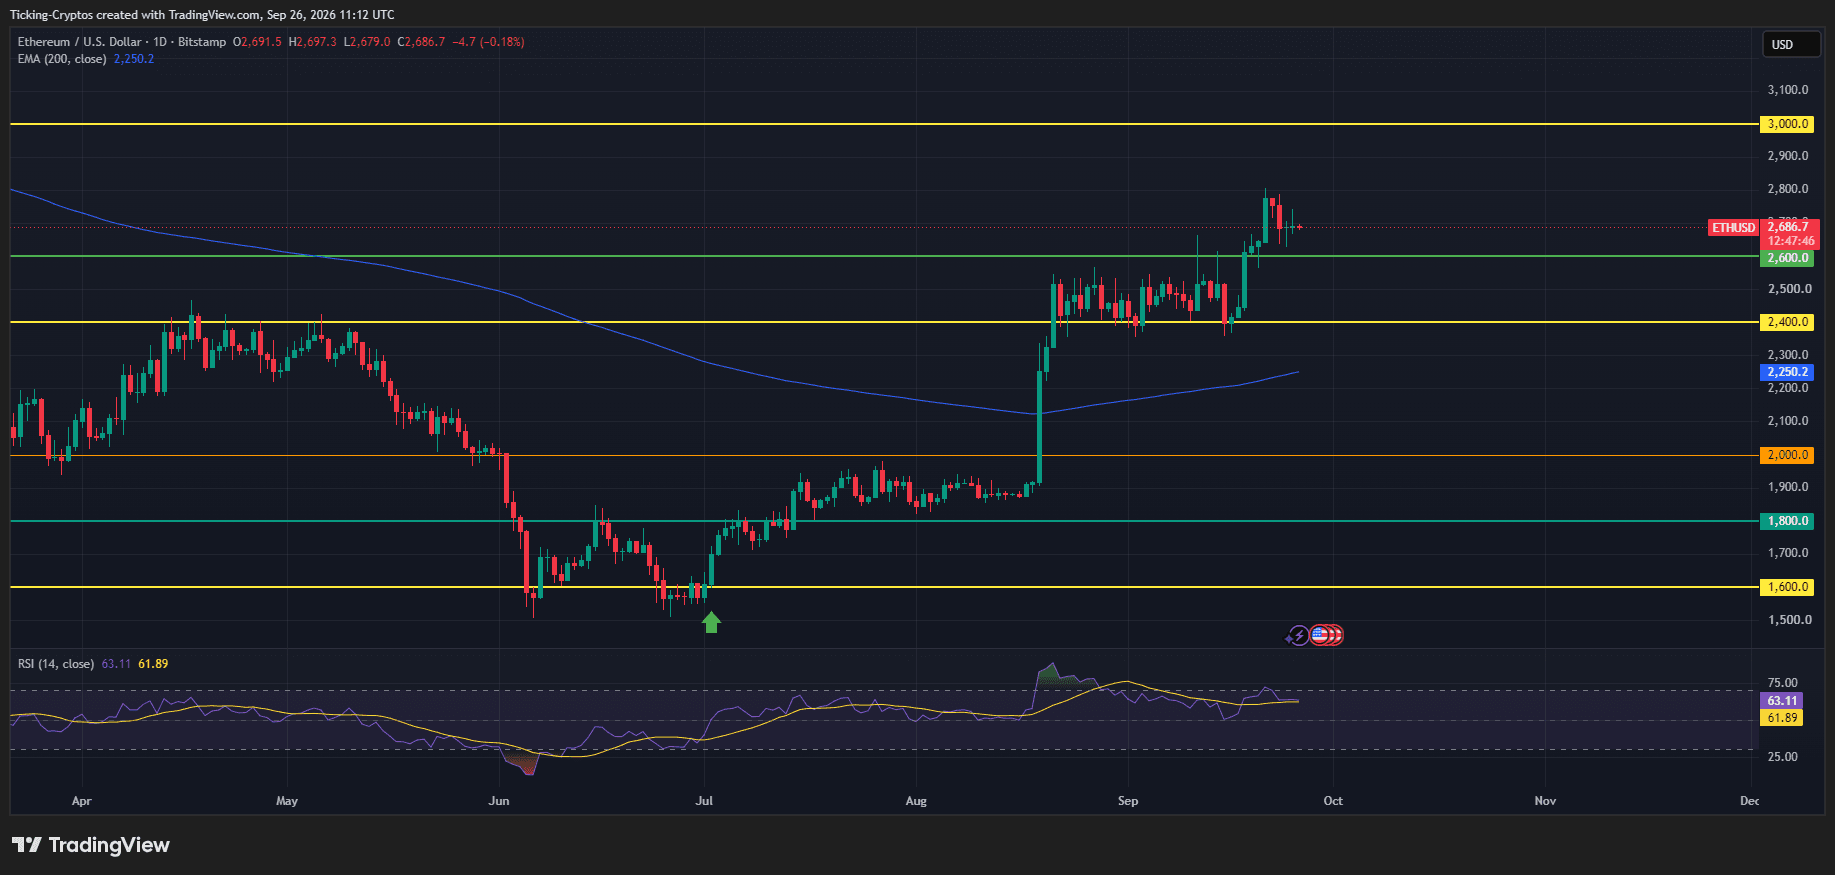

The RSI sits at 63, just above its signal line and well below the overbought readings from early September. $Ethereum has cooled off without breaking anything. Track the live levels on the CryptoTicker charts.
Ethereum Price Prediction: Can ETH Hit $3,000?
The path to $3,000 runs through $2,800. That level rejected the price once, and a daily close above it would turn the current consolidation into a continuation pattern. From there, $3,000 is the obvious magnet, both as a round number and as the next major level on the chart.
As long as ETH holds $2,600, every dip is a higher low inside an uptrend. A retest of $2,800 in the coming week is likely, and a break above it could put $3,000 on the table before the end of October.
What Would Break the Bullish Case?
A daily close below $2,600 would be the first warning sign. It would open the door to $2,400, the top of the old range and the most important support on the chart. Below that, the 200-day EMA at $2,250 is the last line for the uptrend. Until one of those levels breaks, the trend stays up.






Be the first to comment