



HYPE traded near $88 at the time of writing, down about 3.5% over 24 hours and just over 10% from its recent high near $98.
Key Takeaways
- HYPE is more than 10% below its high.
- $87-$88 combines three chart references.
- The rising wedge adds downside risk.
- $79-$80 is the next support area.
- Protocol buybacks are not a price floor.
HYPE is testing its nearest support area
HYPE’s pullback has reached the $87-$88 range, the nearest support area on the daily chart. It is a three-way test: the 23.6% Fibonacci retracement near $86.5, the former all-time-high area and the rising diagonal support line all converge there.
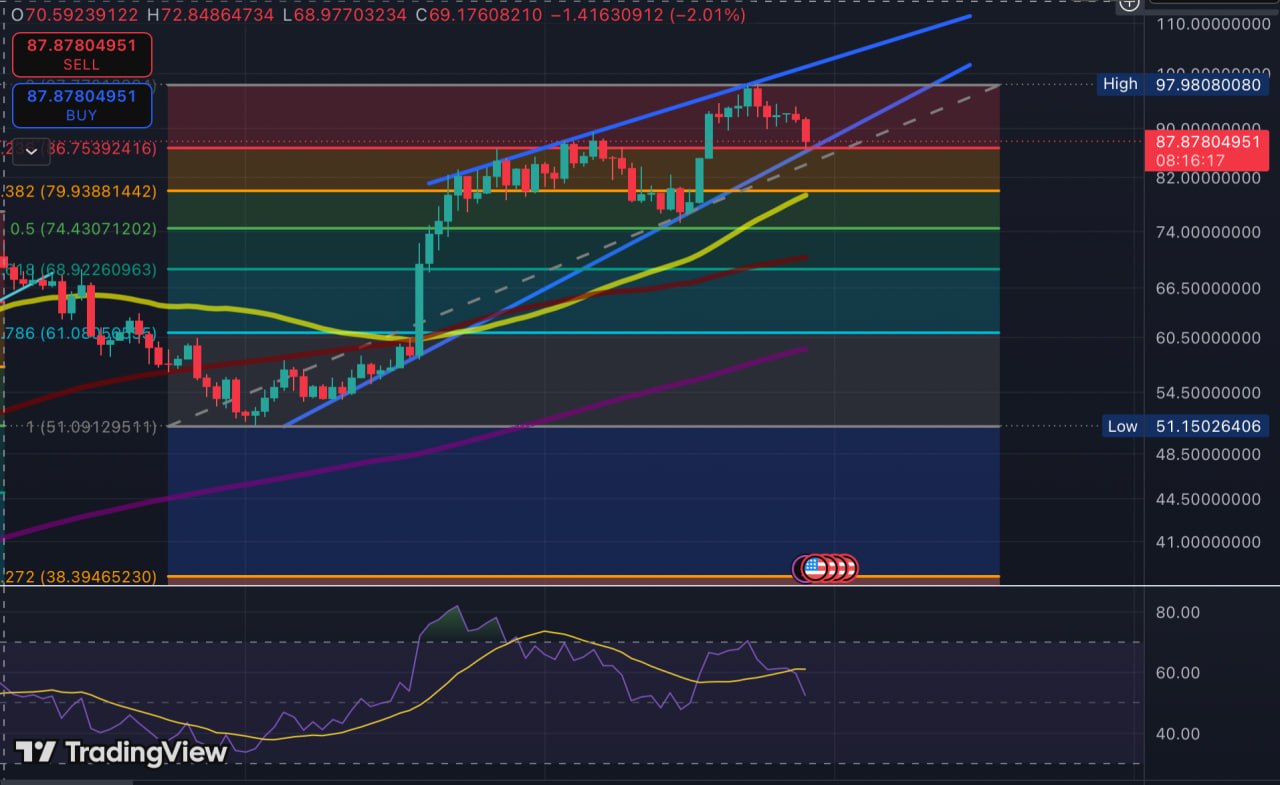
As Coindoo previously covered, HYPE moved above the earlier all-time high near $88 earlier this month. That former ceiling now sits within the pullback range, where traders may watch whether it can begin acting as support.
The overlap does not make $87-$88 an exact level that must hold. HYPE could briefly trade through the range and recover, or remain below it for several sessions. Those outcomes would give very different readings of demand during the pullback.
The rising wedge runs through the same range
The blue trendlines on the daily chart outline a rising wedge. HYPE has continued to make higher highs and higher lows, but the trading range has narrowed as the two boundaries converge.
Rising wedges are commonly viewed as bearish formations because momentum can weaken while price continues climbing within a tightening range. The pattern does not confirm a reversal by itself. It becomes more relevant if price breaks below the lower boundary and cannot quickly reclaim it.
The lower boundary of the wedge passes through the same $87-$88 range. A sustained move below it would therefore weaken both the immediate support area and the upward structure that has contained HYPE’s advance.
The $79-$80 area sits below the current support
If HYPE loses the $87-$88 range and remains below the rising diagonal, the next chart reference sits around $79-$80. The 38.2% Fibonacci retracement lies near $80, while the rising 50-day SMA approaches the same zone.
The 50-day SMA may continue moving higher over time, so the $79-$80 range is more useful than treating one exact moving-average reading as a fixed support number. The 38.2% Fibonacci retracement gives that zone a steadier reference.
If HYPE reaches that range, the important behaviour would be whether buyers can stabilise price near the 50-day average or whether selling extends through that support toward the broader Fibonacci retracement levels below.
Momentum has cooled since the move toward $98
Daily RSI has fallen from its earlier overbought reading above 80 toward the mid-50s. That change shows that the rapid momentum behind HYPE’s recent advance has eased.
That cooldown leaves HYPE without the momentum excess visible near the high. It does not settle the direction of the correction; price behaviour around the support range remains more informative than the indicator alone.
Buybacks are background, not a price floor
Hyperliquid’s fee documentation says protocol fees are directed to community mechanisms, including the Assistance Fund, and that HYPE acquired by the fund is burned.
The mechanism is supported by substantial recent protocol activity. DefiLlama’s latest dashboard snapshot showed Hyperliquid generating about $71.1 million in fees over the previous 30 days, including roughly $55.2 million in protocol revenue. That works out to more than $2 million in daily fees on average, indicating that the protocol’s fee engine has remained active during the period.
If activity remains at a similar level, it could continue supporting the fee flows behind Hyperliquid’s community mechanisms, including the Assistance Fund. The fee figures are a measure of protocol activity, however, not a calculation of how much HYPE will be purchased or burned over a given period.
A technical support zone can still fail when market-wide risk appetite, spot selling or leveraged positioning turn against the token.
HYPE is now testing its post-breakout structure
The current pullback has reached the range where HYPE’s earlier breakout needs to show whether it can hold as support. A recovery from $87-$88 could keep the decline within the broader structure behind the move toward $98.
Continued trading below the rising diagonal would weaken that reading and place the $79-$80 area under closer attention. The wedge means that a break at the current range may carry more significance than an ordinary intraday decline.
This article is provided for informational purposes only and does not constitute financial or investment advice. Technical levels and chart patterns are interpretive tools, not guarantees of future price movement.

Kosta has reported on cryptocurrency markets and blockchain infrastructure since 2020, bringing over six years of hands-on experience in the crypto industry built through daily tracking of markets, trends, and emerging blockchain developments. Specializing in Bitcoin on-chain analysis, institutional ETF flows, and digital asset price action, his work at Coindoo has been cited by other news agencies and consistently covers market developments with a focus on data-driven reporting across Bitcoin, Ethereum, Solana, and XRP.
Over the years, Kosta has contributed to multiple crypto media outlets in different regions, authoring over 6,000 articles across the sector. His reporting spans cryptocurrency markets and the broader fintech industry, tracking not only price action but also the technological and regulatory forces shaping the ecosystem.
To support his analysis, Kosta actively leverages on-chain data and metrics from leading platforms such as Santiment, Glassnode, and CryptoQuant, enabling deeper, evidence-based market insights. He believes in the power of transparency and the data that underpins the blockchain ecosystem.
His academic background in Marketing Management from Denmark further complements his analytical approach, adding a strong understanding of communication strategy and content positioning to his work.



Be the first to comment