



Hyperliquid’s HYPE traded near $88.45 on Oct. 1, down 2.74% on the daily chart, as Hyperliquid Policy Center pressed European regulators to classify perpetual futures under existing derivatives rules.
Summary
- Hyperliquid price traded near $88.45, roughly 9.6% below the $97.88 peak marked on its daily chart.
- Daily RSI stood at 52.58, below its moving average of 61.17.
- The 4-hour Bollinger Bands placed nearby technical levels at $87.89, $84.84 and $90.95.
- HPC urged European regulators to classify perpetual futures by their economic features rather than blockchain use.
The token remained below its recent $97.88 peak, with the 4-hour chart placing the next nearby resistance around $90.95.

Hyperliquid faces resistance near $91
TradingView’s KuCoin HYPE/USDT daily chart showed a session high of $91.105 and a low of $88.119. The price stood near the lower end of that range after retreating from the late-September peak.
HYPE’s latest decline followed a recovery from roughly $85 on the 4-hour chart. That rebound carried the token back above $90 before selling pushed it toward $88.46, leaving the recovery below the recent trading area around $92–$95.
The 4-hour Bollinger Bands showed an upper boundary of $90.946, a midpoint of $87.894, and a lower boundary of $84.843. The upper band closely matched the daily high, placing the first resistance zone around $90.95–$91.11.
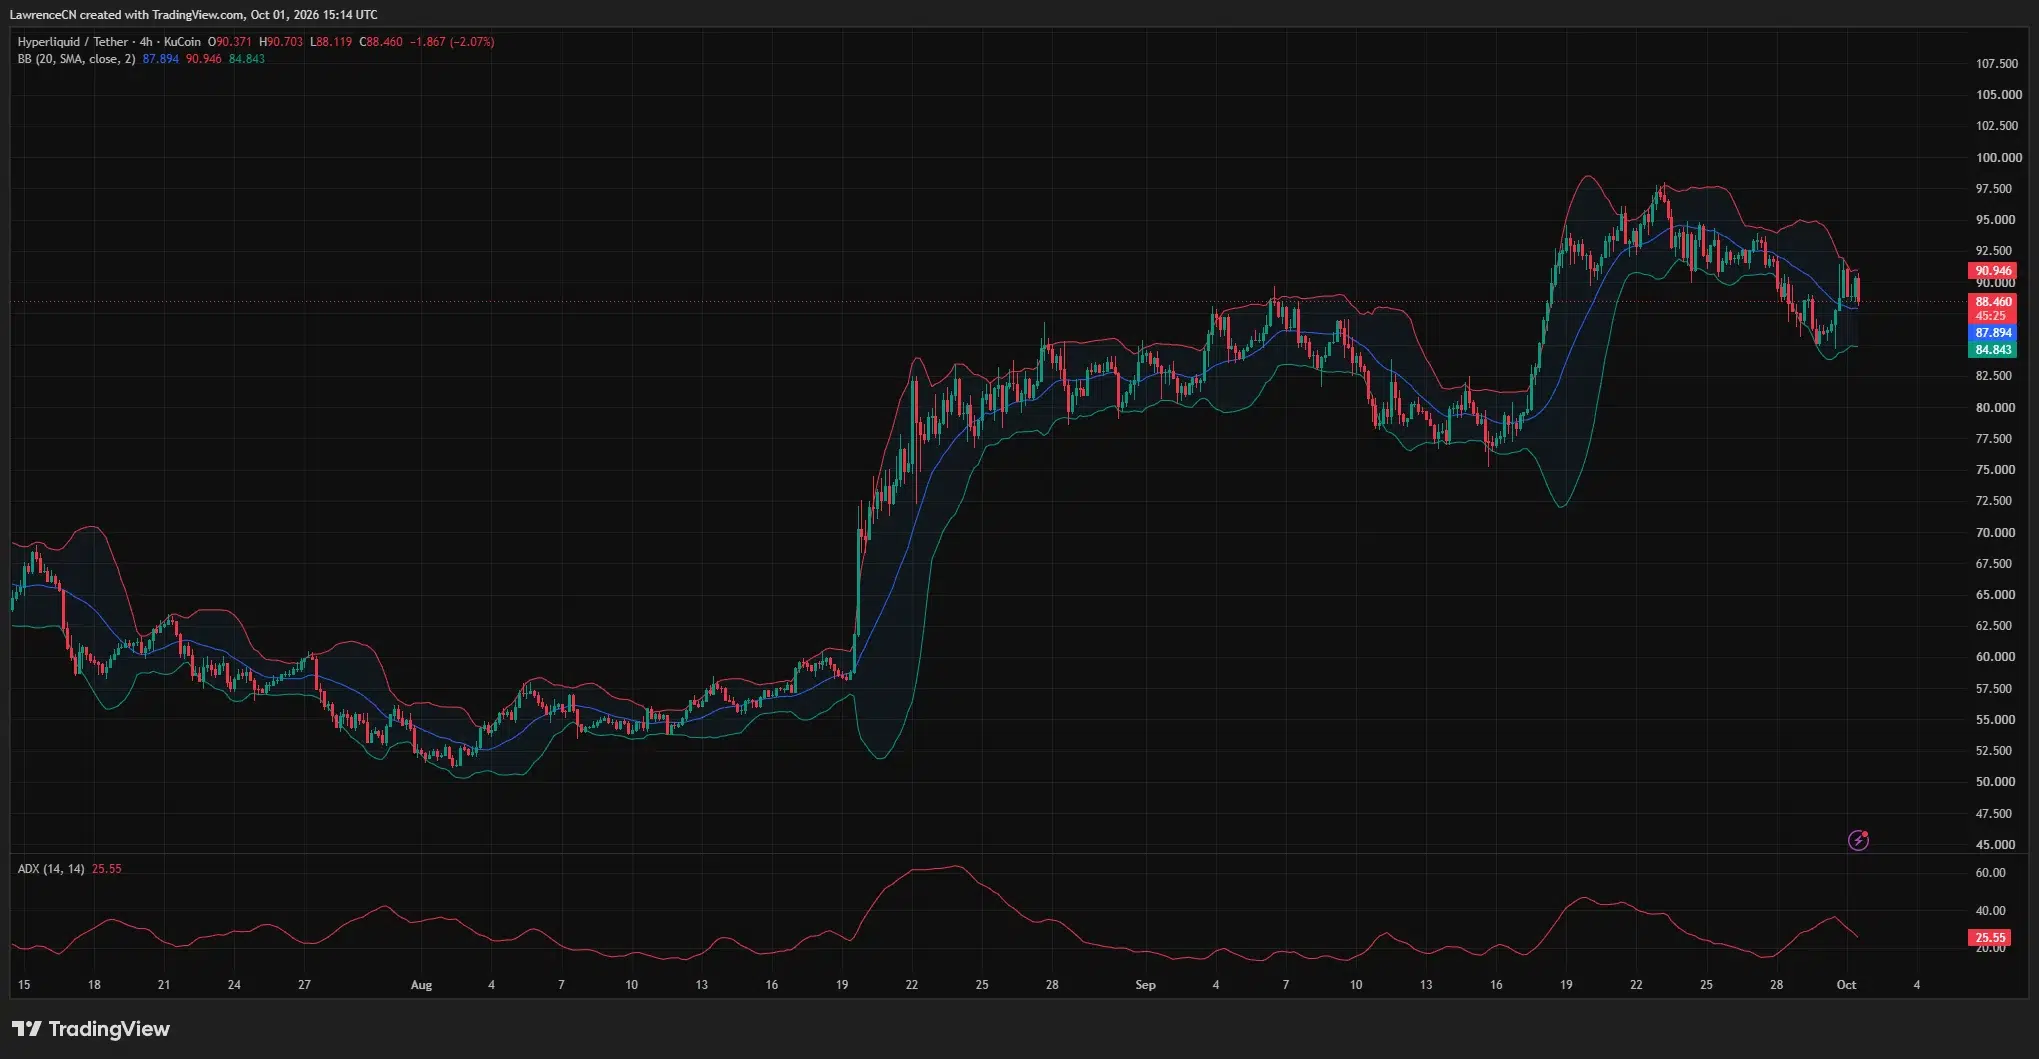
A sustained move above that zone would put the recent $92–$95 trading area back in focus. Beyond it, the daily chart’s marked high of $97.876 remains the next major reference, followed by the round-number $100 level.
At $88.45, HYPE would need to gain roughly 10.7% to revisit $97.88. The chart therefore places an initial resistance test near $91 before any attempt to recover the full decline from the peak.
Daily momentum cools as $87.89 becomes the first support test
The daily relative strength index stood at 52.58, above the neutral 50 level but below its moving average of 61.17. Earlier readings had reached the overbought area during the advance, while the latest reading showed weaker momentum after the pullback.
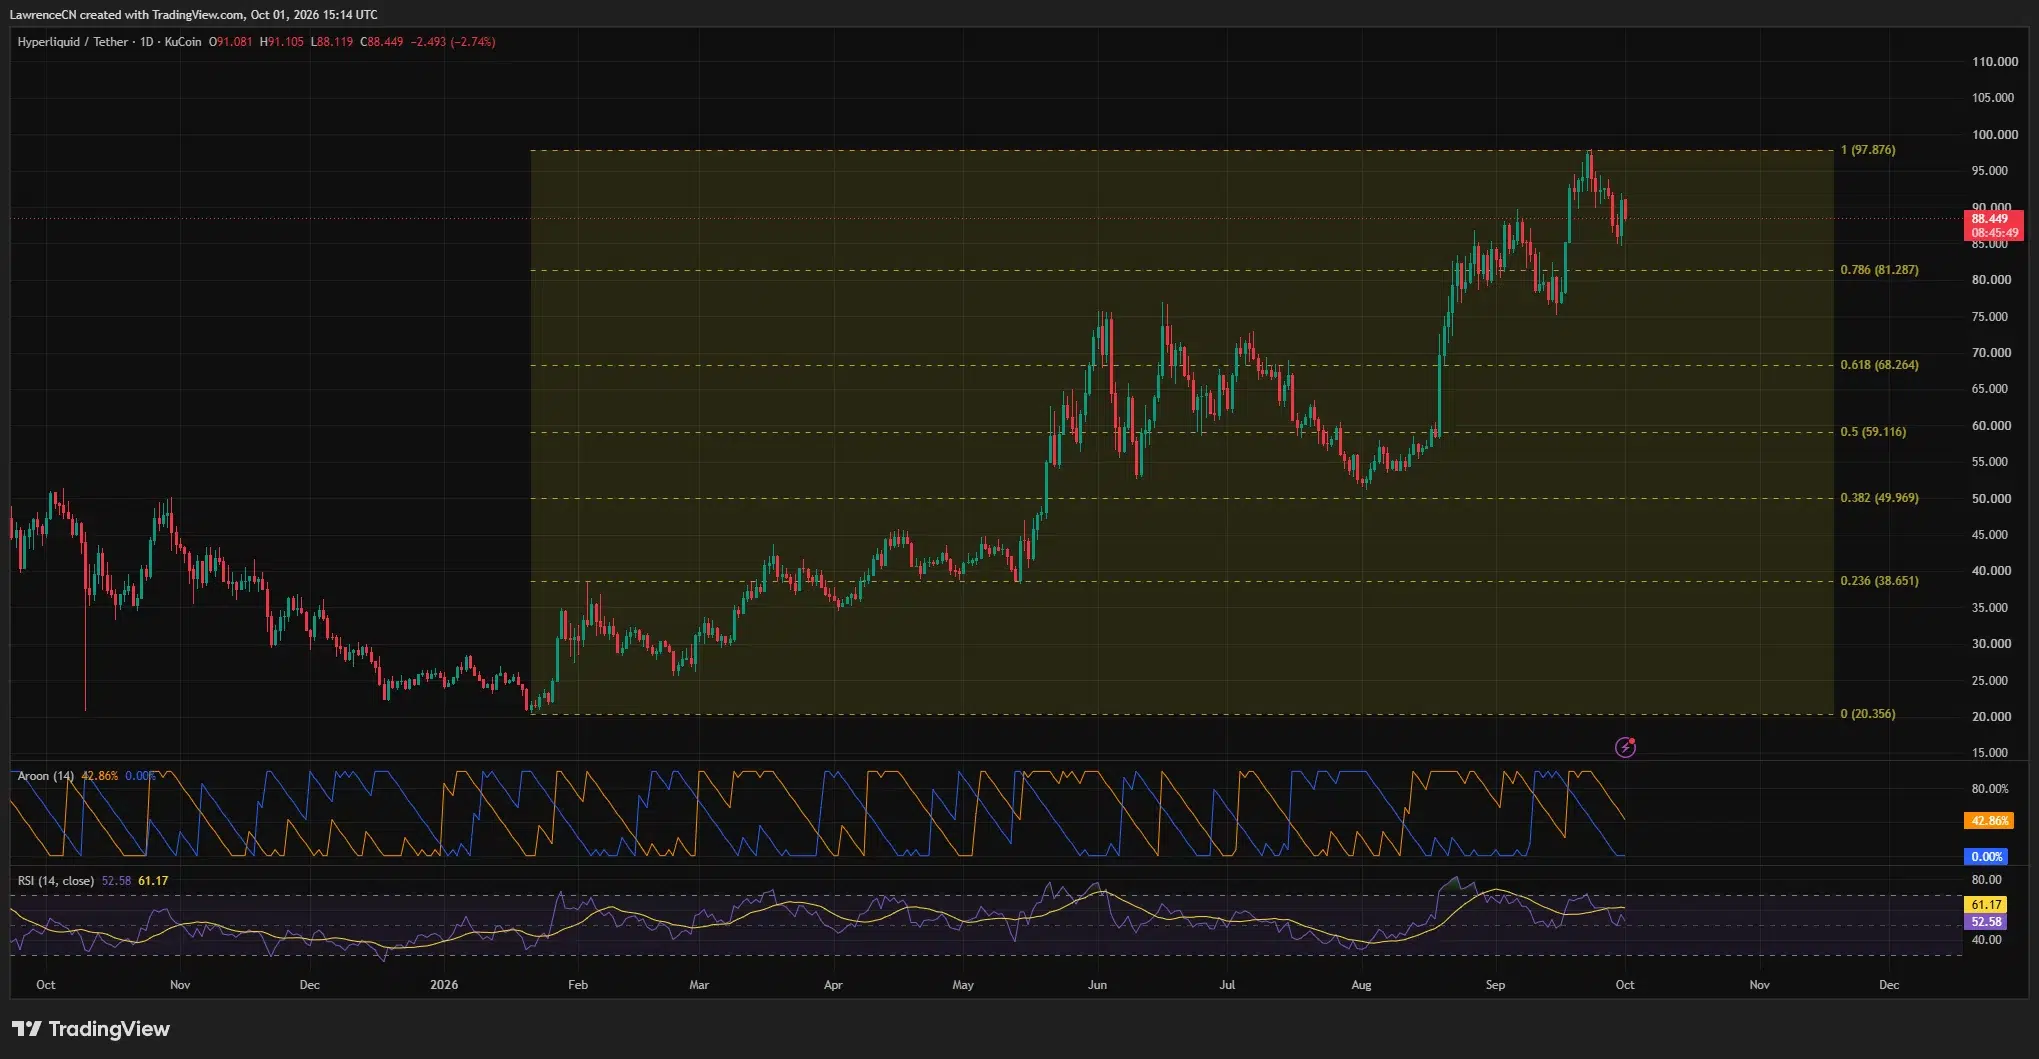
The daily Aroon panel showed Aroon Up at 42.86% and Aroon Down at 0%. The declining Up reading reflected the increasing distance from the recent high, while the Down reading remained at zero.
On the 4-hour chart, HYPE traded only about 0.6% above the Bollinger midpoint at $87.89. Holding that level would preserve the rebound above the indicator’s 20-period average; a move below it would bring the lower band near $84.84 into focus.
The daily Fibonacci overlay placed the next lower reference at $81.287, its 0.786 level. That area sits roughly 8.1% below $88.45 and near a zone HYPE traded through repeatedly during its August and September advance.
Below $81.29, the September trough around $76–$78 provides another visible reference. The daily overlay’s next Fibonacci level lies farther down at $68.264.
The 4-hour average directional index read 25.55 and had fallen from its late-September readings. ADX measures trend strength rather than direction, so the latest reading does not establish an upward breakout. The price remains between the nearby $87.89 midpoint and resistance around $91.
HPC seeks derivatives treatment for perpetual futures
Hyperliquid Policy Center submitted its position during the European Commission’s review of the Markets in Crypto-Assets Regulation. The group argued that a financial instrument should retain its treatment under MiFID II when issued or traded on a public blockchain.
HPC wants regulators to classify products by their economic features. Its submission argued that perpetual futures share characteristics with derivatives already covered by MiFID II, despite having no fixed expiry date.
The group asked for confirmation through existing European Securities and Markets Authority guidelines rather than a separate category for crypto-linked perpetual contracts. It also called for rules that preserve access to global liquidity.
HPC’s argument distinguishes order-book perpetuals from contracts for difference, whose providers can act directly as customers’ counterparties. ESMA’s current position requires firms to assess the actual product: in February, the regulator said derivatives marketed as perpetual futures were likely to fall within existing CFD intervention measures where they meet the CFD definition. Those measures include leverage limits, margin close-out requirements and negative balance protection.
HPC also proposed using independently verifiable blockchain records to meet transparency obligations. Its recommendations covered trades, funding payments, orders and liquidations, alongside disclosures of funding rates, margin requirements, reference prices and position-closing rules.
Borrowing expansion accompanies plans for US markets
Hyperliquid launched manual borrowing on Sep. 18, allowing users to borrow USDC and USDT against supported collateral. The platform reported $269 million borrowed across the underlying infrastructure, which also supports its portfolio margin system.
Permissioned HIP-3 markets add access controls through onchain allowlists managed by deployers or designated sub-deployers.
A US proposal uses that structure. Payward, Kraken’s parent company, announced on Sep. 16 that it intended to deploy Hyperliquid perpetual markets for US clients, subject to regulatory approval. Its plan assigns market operation and clearing to Bitnomial, with NinjaTrader Clearing carrying client accounts; trading would require inclusion on both firms’ allowlists.
For HYPE’s price, the immediate technical thresholds remain closer: $90.95–$91.11 overhead and $87.89 below. A break above resistance would reopen the route toward $95 and $97.88, while a loss of the midpoint would shift attention toward $84.84 and $81.29.
Disclosure: This article does not represent investment advice. The content and materials featured on this page are for educational purposes only.



Be the first to comment