




TLDR
- Analyst Ali Martinez says XRP is forming an ascending triangle on its monthly chart, with resistance near $3.66.
- A confirmed breakout above $3.66 could open a path toward $31.87, based on the pattern’s measured target.
- Martinez also mapped long-term targets for Bitcoin ($190,000), Ethereum ($8,800), and Solana ($2,744).
- A separate two-week fractal shows XRP could rally 125% toward $3.40-$3.50 if past cycles repeat.
- Large XRP transfers now make up a bigger share of exchange outflows on Binance and Coinbase.
XRP was trading around $1.48 on October 3, down slightly over the past day.
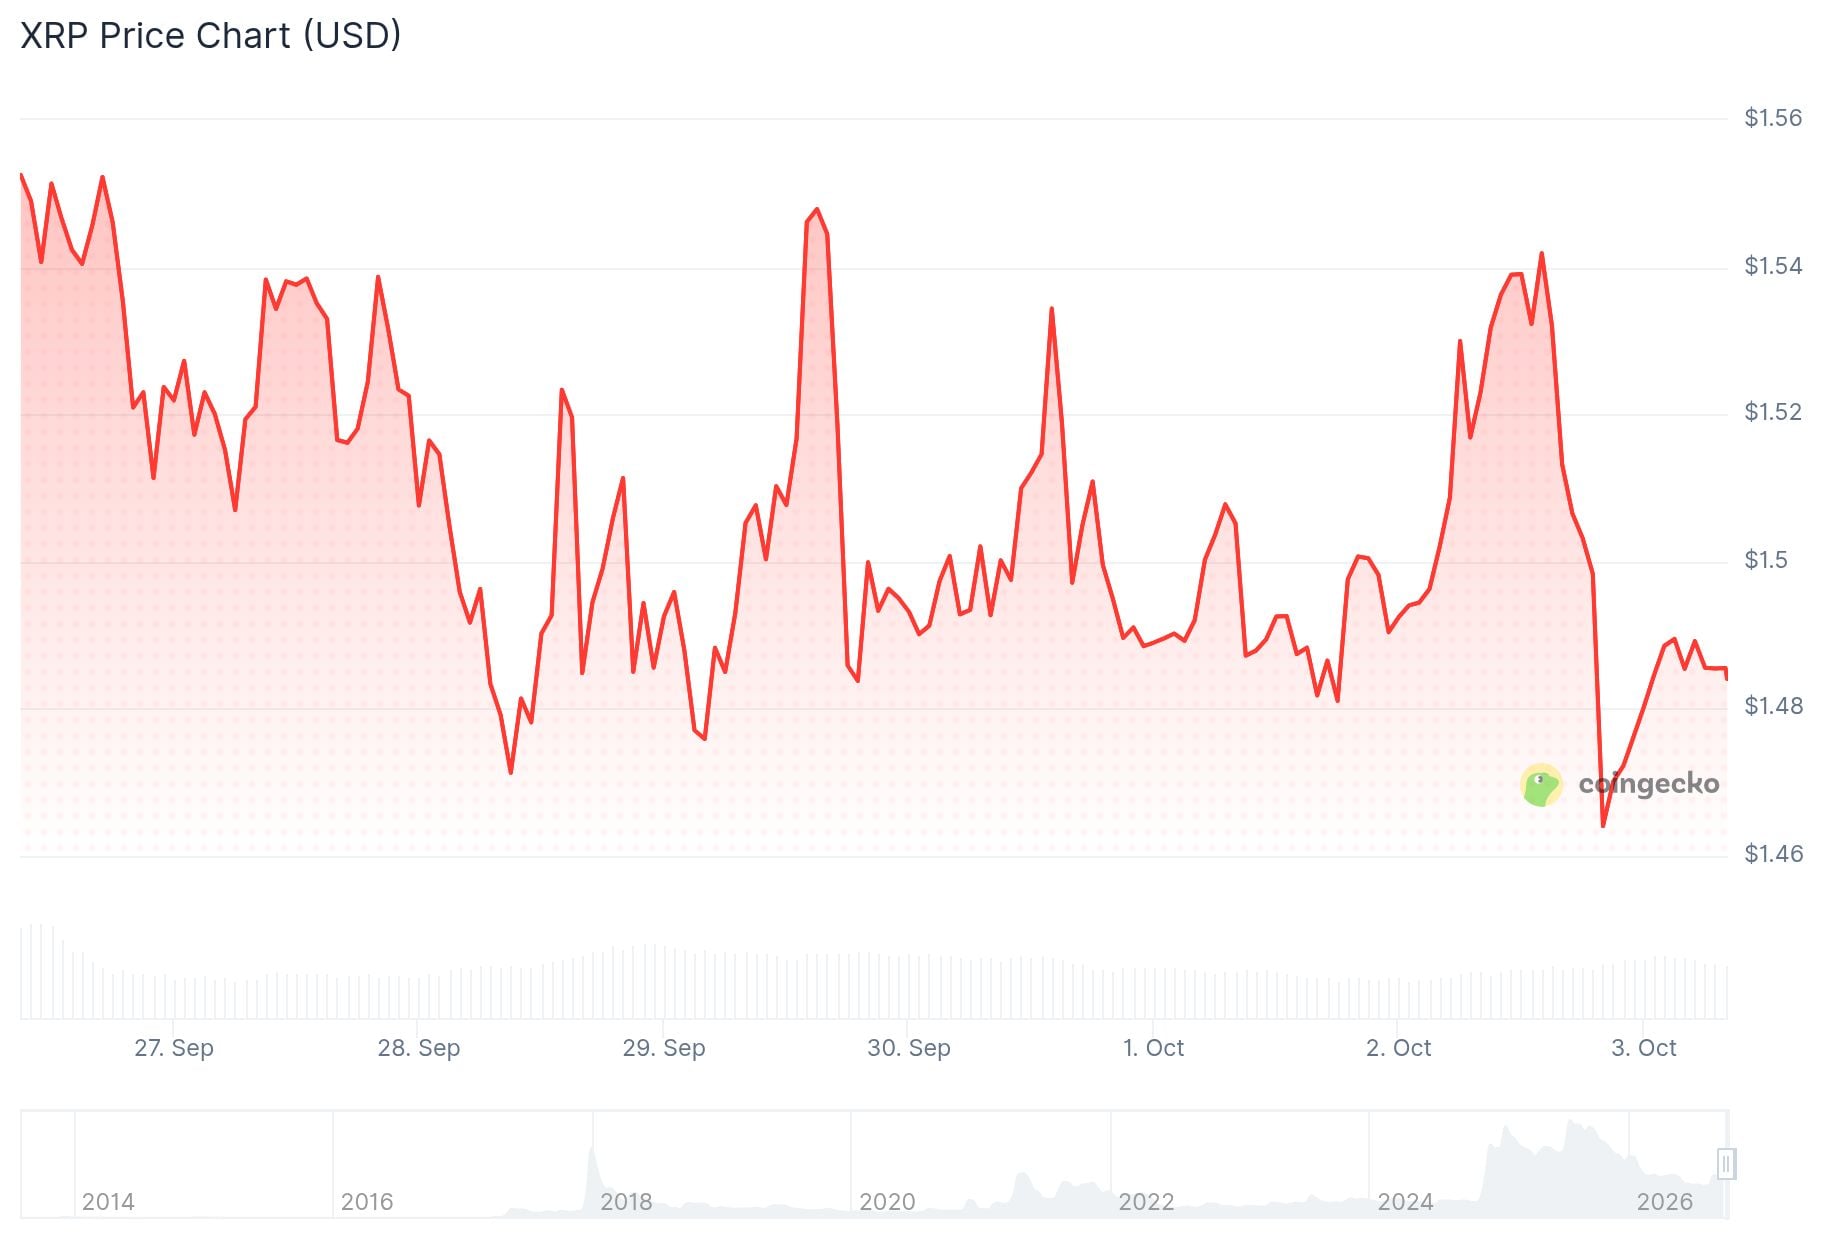
The token has still gained more than 50% since its August lows, tracking a wider recovery across crypto markets.
Analyst Ali Martinez has been studying XRP’s monthly chart. He says the token is forming an ascending triangle pattern.
4/6 $XRP appears to be forming an ascending triangle on its monthly chart, with resistance near $3.66.
A monthly close above that level would confirm the breakout and bring the pattern’s projected target near $31.87 into view. pic.twitter.com/26cqEieeUo
— Ali Charts (@alicharts) October 2, 2026
That pattern has a resistance level near $3.66. XRP has tested this level several times without closing above it.
Martinez says a monthly close above $3.66 would confirm a breakout. He adds that the pattern’s measured target then points to $31.87.
A move from current levels to $31.87 would mark a rise of close to 2,000%. Martinez says this is only a projection, not a guarantee.

Comparing XRP To Bitcoin, Ethereum, And Solana
Martinez looked at other major assets using similar long-term chart structures.
For Bitcoin, he pointed to a rising channel that has held for two years. A break of the upper channel line could bring a move toward $190,000, about 125% above its current price.
Ethereum has built a channel over five years on the monthly chart. If the trend turns up from $5,000, Martinez’s target sits at $8,800, a gain of 231%.
Solana shows a cup-and-handle pattern with a neckline near $295. A breakout there could open a path to $2,744, a rise of about 2,186%.
Trader MikybullCrypto also weighed in on XRP’s setup. The analyst wrote that $XRP “is one of the most bullish charts out there,” naming a target range of $5 to $7 if the breakout plays out.
$XRP is one of the most bullish charts out there
A valid target of $5-$7 in this breakout pic.twitter.com/u1jzDzh6i4
— MikybullCrypto (@MikybullCrypto) October 2, 2026
That view lines up with the triangle pattern Martinez has been tracking, though the two analysts use different target ranges.
A Second Pattern Points To A Smaller, Faster Move
Separately, analysis from FXEmpire highlights a two-week fractal on XRP’s chart.
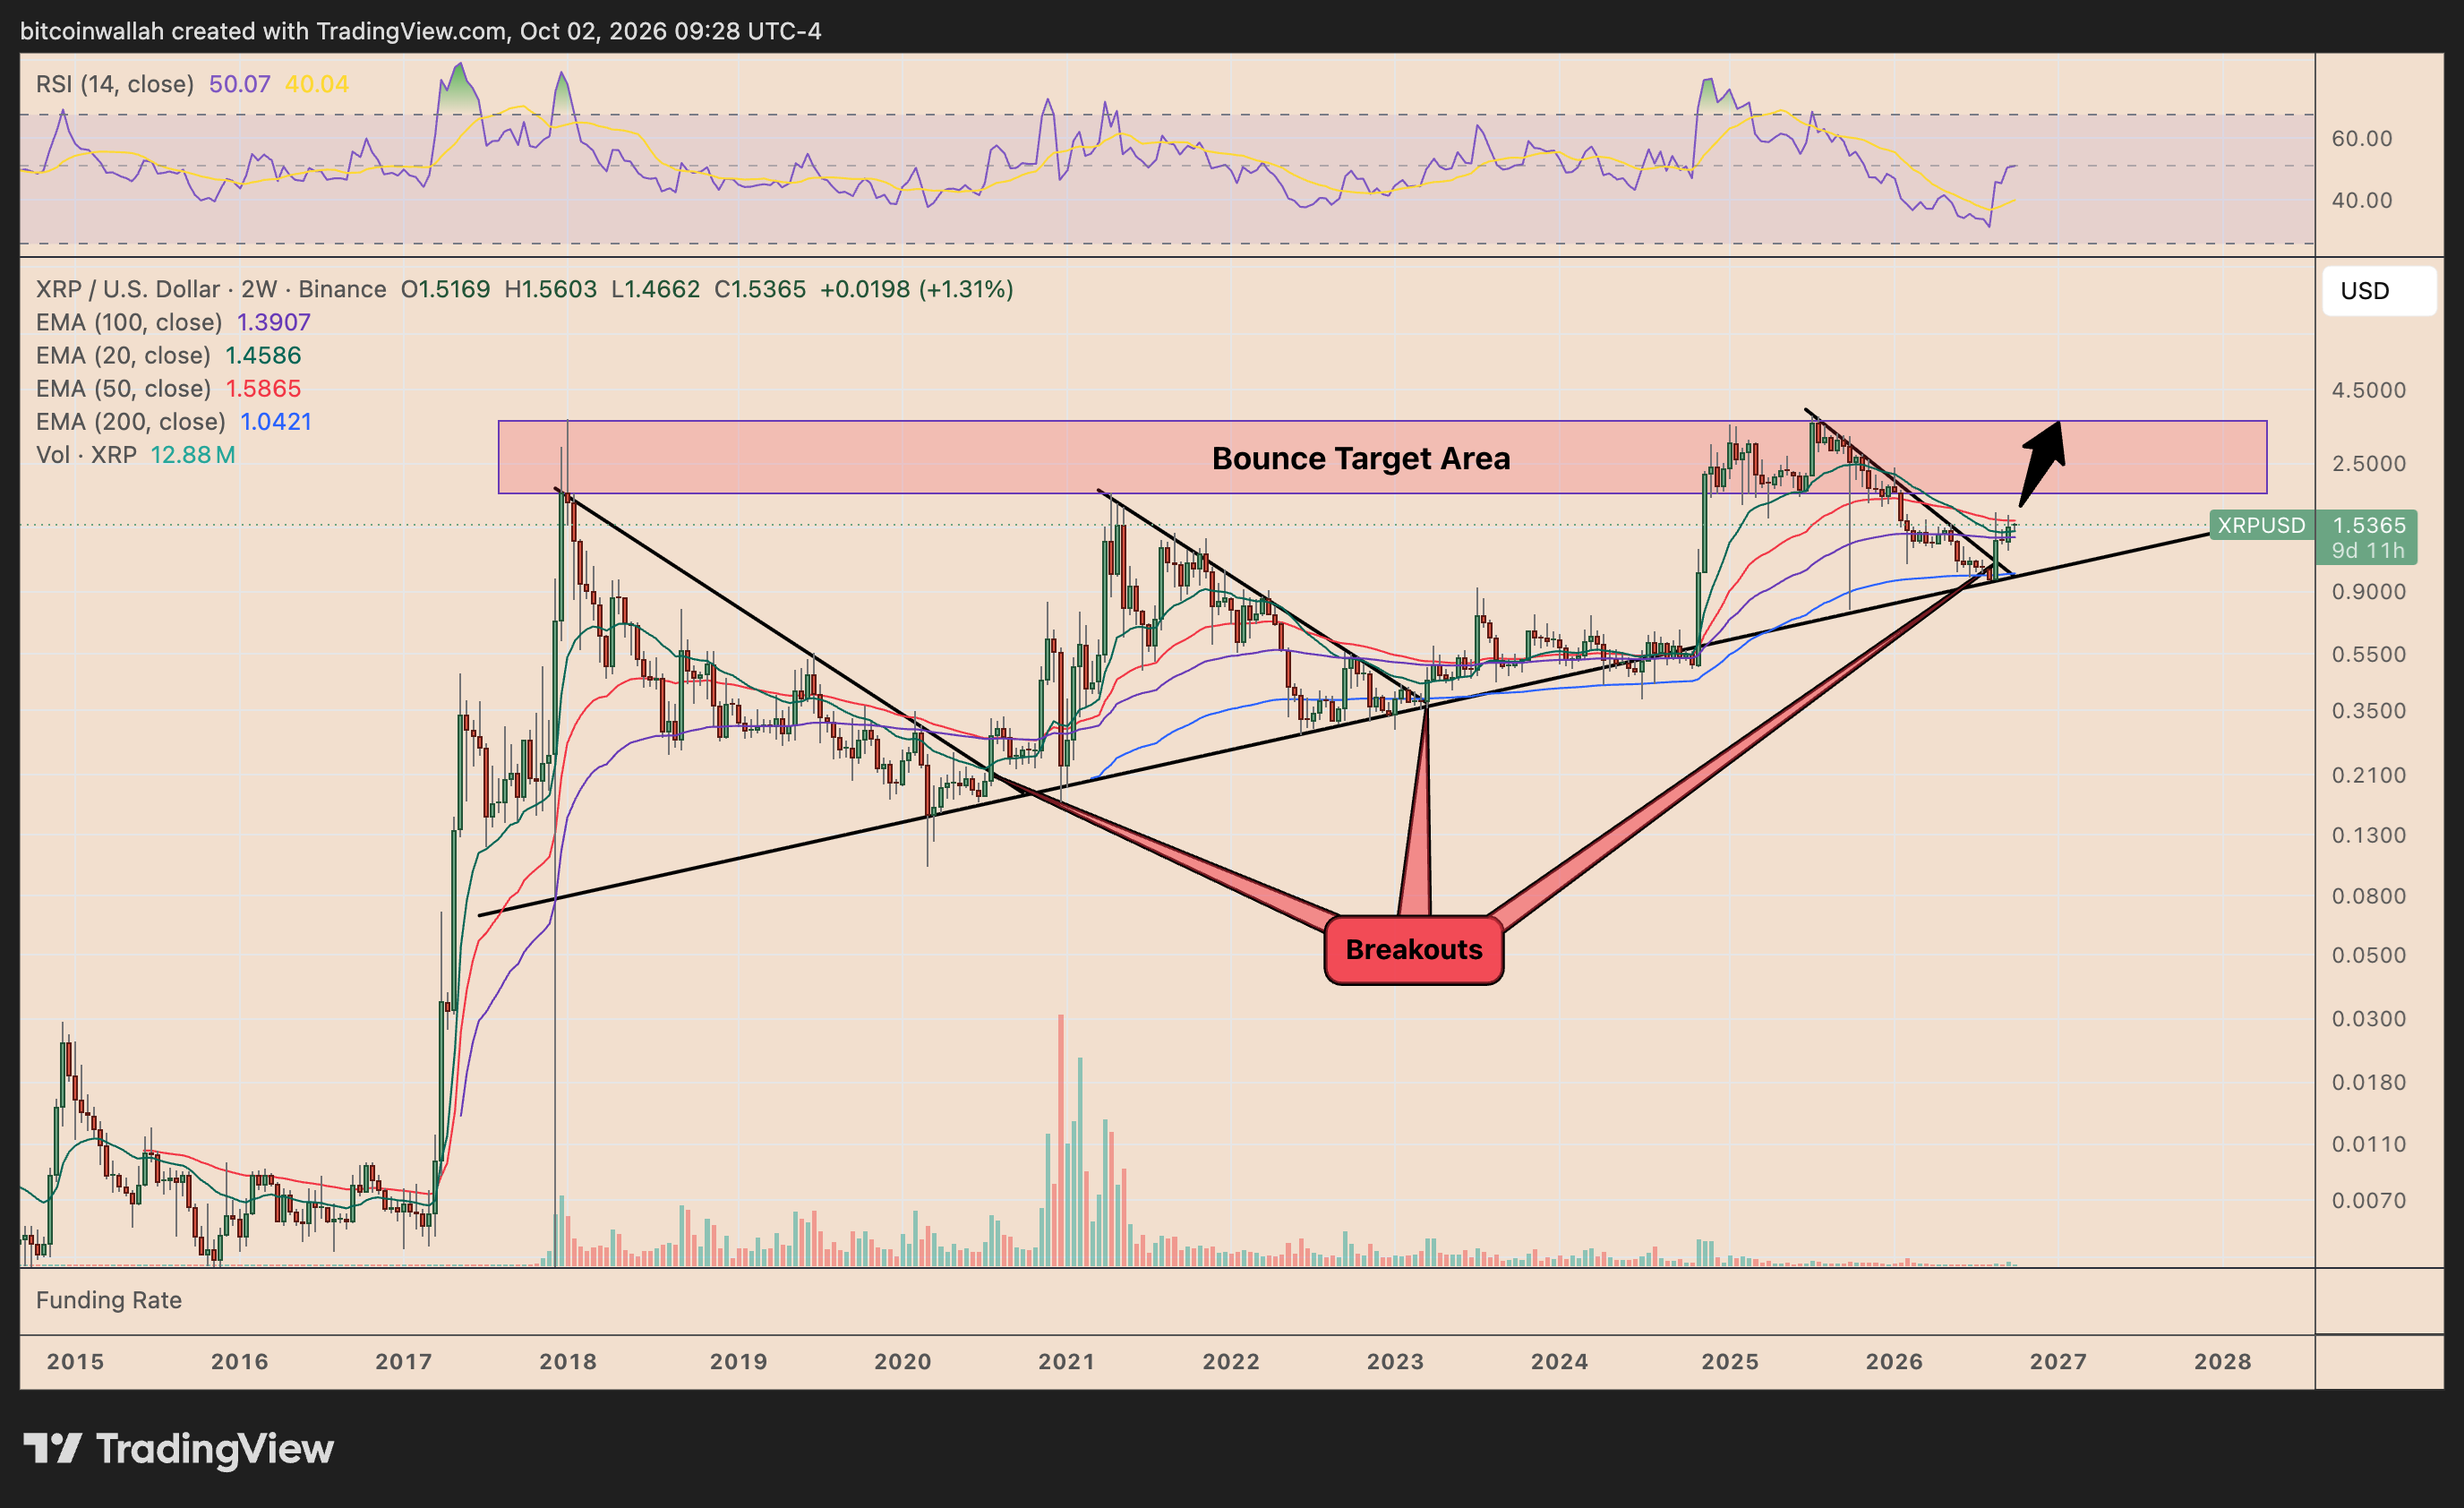
In past cycles, XRP formed a falling resistance line after each major peak, while a long-term rising support line held underneath.
That setup appeared after the 2018 peak, leading to a 900% rally into 2021. It appeared again after 2021, leading to a 150% move into 2025.
The pattern appears to be forming a third time. XRP is rebounding from the point where its falling resistance meets the long-term rising support.
Its two-week RSI has climbed back toward 50. The token trades above its 20-period and 100-period EMAs, though reclaiming the 50-period EMA near $1.59 would strengthen the case further.
If the fractal repeats, XRP could revisit $3.40-$3.50, a move of roughly 125% from current levels.
Exchange data adds another data point. On Binance, transfers above 1 million XRP made up 60.8% of daily outflow value on September 30, up from about 45% in mid-August.
Coinbase showed a similar pattern, with million-plus transfers rising to 48.7% of outflow value by the end of September, up from roughly 30% in early July.


Be the first to comment