



Bitcoin is trading around $84,700 on October 4 after another failed attempt to sustain its recovery above $87,000, leaving BTC caught between improving futures demand and persistent selling near resistance.
The immediate trading range sits between $82,000 and $86,000, while $88,000 remains the more important daily breakout level. A confirmed move above $88,000 would strengthen the case for an advance toward $90,000 and potentially $96,000. Losing $82,000, however, would expose the broader $74,000 to $78,000 demand zone.
Bitcoin’s futures Taker Cumulative Volume Delta (CVD) has also returned to positive territory, indicating renewed aggressive buying in derivatives. The latest momentum improvement comes as the Bitcoin-to-gold ratio approaches another potential breakout, although neither signal has pushed BTC through overhead resistance yet.
Bitcoin Holds Near $84.7K After Latest Resistance Rejection
Bitcoin briefly challenged the $87,000 region before reversing toward $83,800, where buyers stepped in to prevent a deeper decline.

The subsequent stabilization around $84,700 keeps BTC within its established consolidation range, but repeated failures near $86,000 to $88,000 show sellers continue to defend the upper boundary.
The daily chart remains relatively constructive following Bitcoin’s recovery from the $60,000 area during the summer. The price broke above its previous $66,000 consolidation, reclaimed $75,000 and established a sequence of higher highs and higher lows.
| Bitcoin Level | Role |
| $86,000 | Immediate range resistance |
| $87,000-$88,000 | Major breakout zone |
| $90,000 | Psychological resistance |
| $95,000-$96,000 | Higher upside target |
| $83,800-$84,000 | Immediate support |
| $82,000-$82,500 | Main short-term support |
| $74,000-$78,000 | Broader demand zone |
| $66,000 | Deeper structural support |
Table 1. Bitcoin Key Support and Resistance Levels
$88K Is the Main Level Bitcoin Needs to Break
The four-hour chart shows Bitcoin consolidating within a slightly descending range, with resistance around $86,000 and support near $82,000.
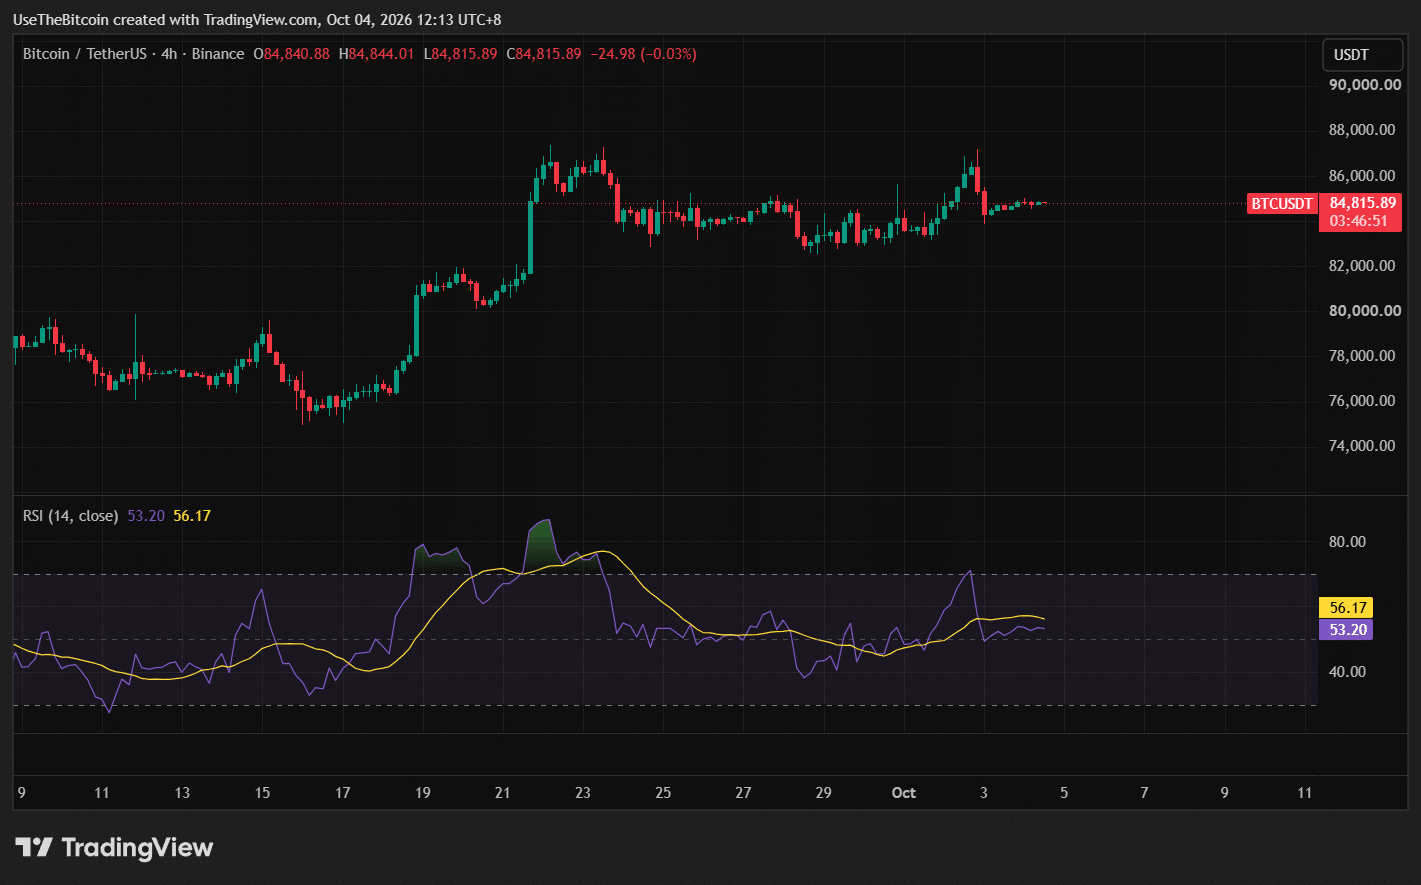
A sustained four-hour close above $86,000 would indicate that buyers are beginning to overcome the immediate selling pressure.
However, the stronger confirmation would come from a daily close above $88,000, which has acted as the broader resistance ceiling during the recovery.
Clearing that area would bring $90,000 into focus, followed by approximately $95,000 to $96,000 if momentum continues.
Until then, Bitcoin’s price remains inside a consolidation pattern rather than a confirmed bullish continuation.
Futures Taker CVD Turns Positive Again
One encouraging development is the improvement in Bitcoin’s futures order flow. The 90-day Futures Taker CVD, which measures the cumulative difference between aggressive market buyers and sellers, has shifted back into positive territory.
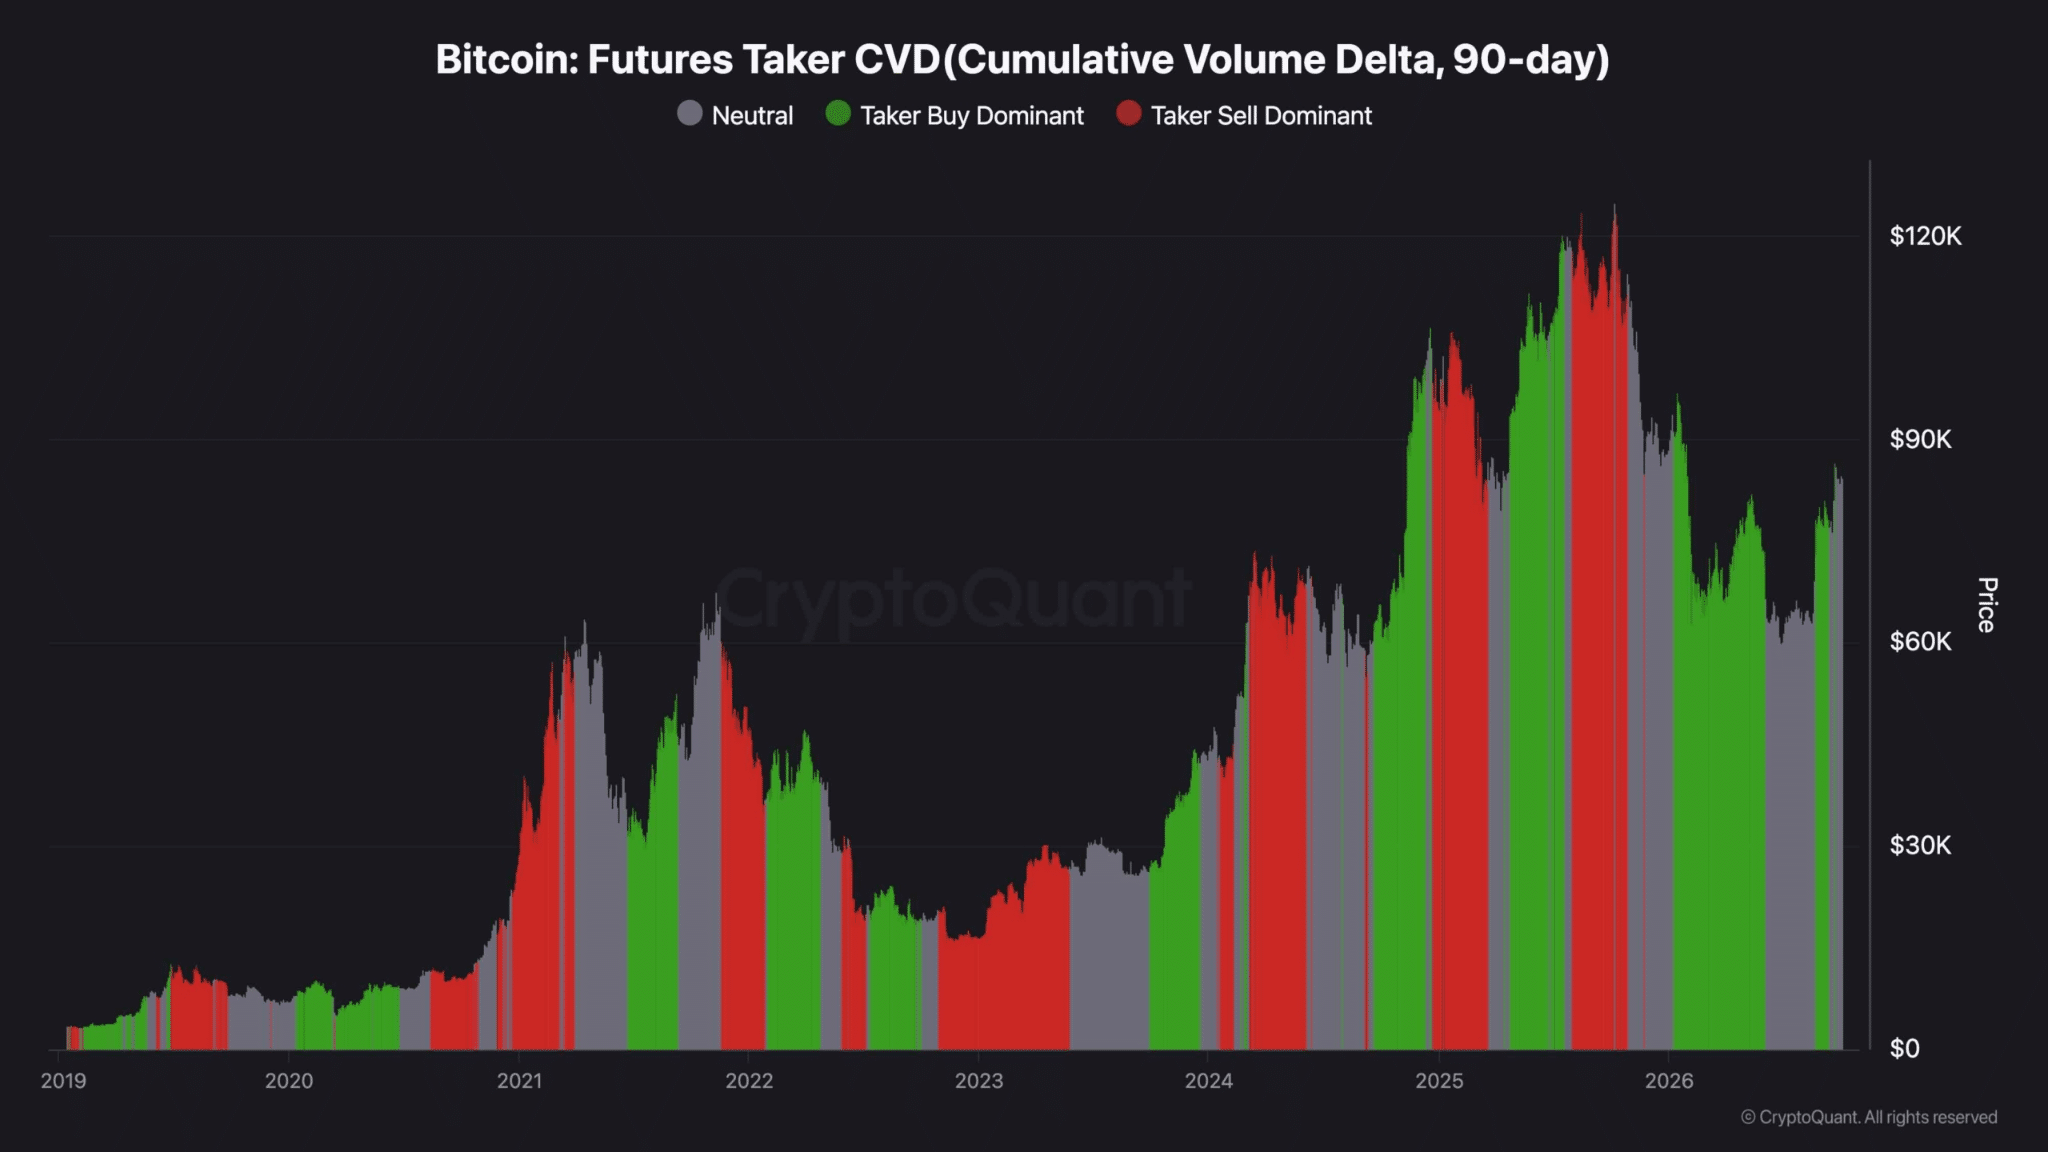
Positive readings indicate that buyers are increasingly executing market orders against available sell liquidity rather than sellers dominating transactions.
The recent shift follows a period of neutral-to-negative futures activity and has accompanied Bitcoin’s recovery toward $85,000.
However, another possibility worth monitoring is that if the CVD continues rising while Bitcoin repeatedly fails to clear $86,000 to $88,000, it could indicate that aggressive buyers are being absorbed by larger sell orders.
A breakout supported by continued positive CVD would provide stronger confirmation than futures buying alone.
Daily Momentum Remains Stronger Than the Four-Hour Chart
Bitcoin’s momentum indicators continue to show different conditions across timeframes.
The four-hour Relative Strength Index (RSI) has returned toward 50, indicating relatively balanced short-term momentum after the latest rejection.
On the daily chart, the October 3 technical snapshot placed RSI near 63.87, while the 50-day moving average remained above the 200-day average.
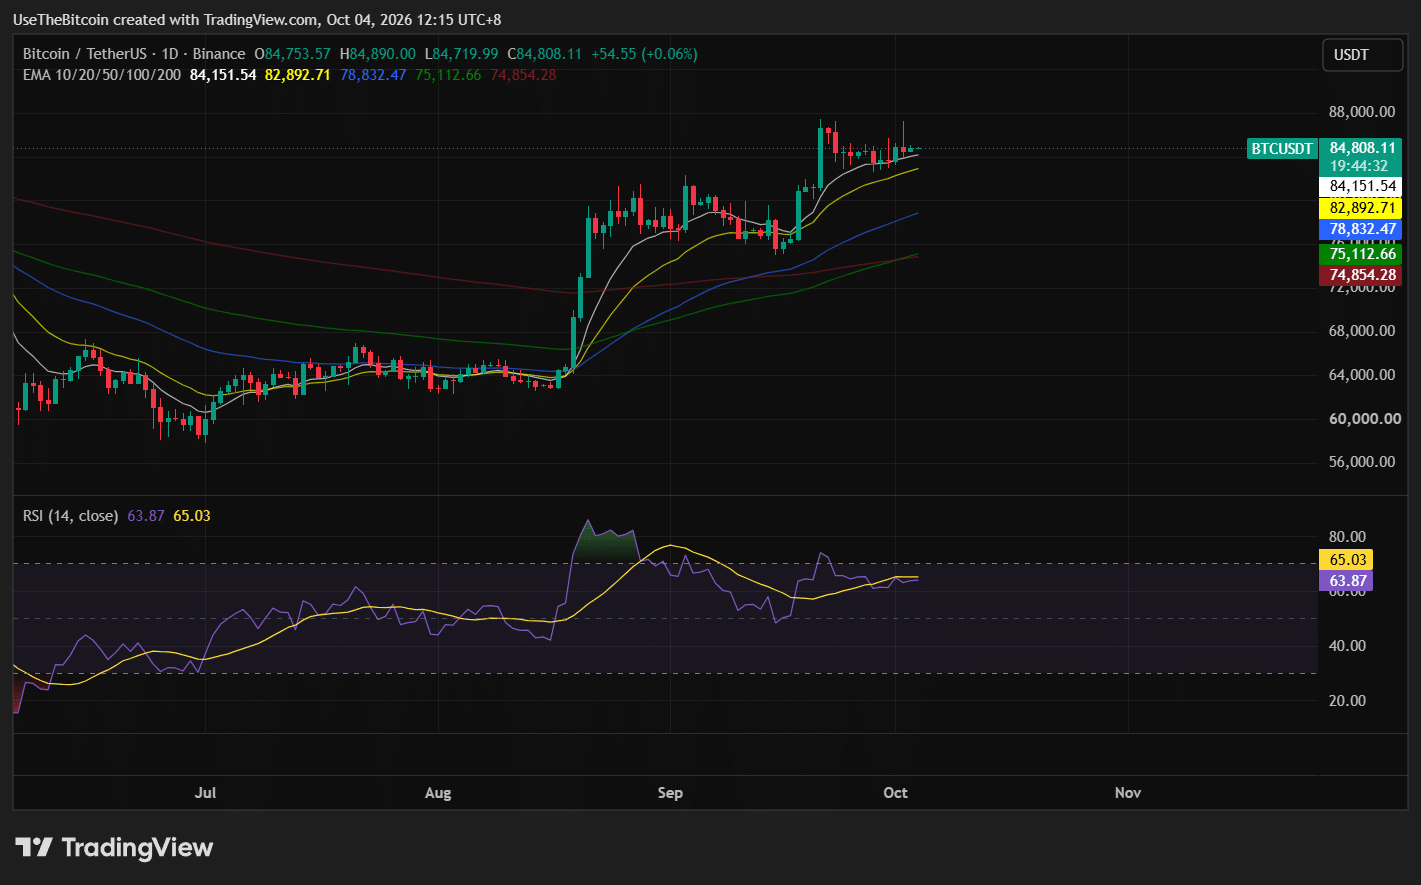
The longer-term moving averages are also positioned below the current price. Moreover, the 100-day and 200-day exponential moving averages are converging around $74,000-$75,000, with the 100-day average rising toward the 200-day.
A potential bullish crossover would reflect the recovery already underway, but it remains a lagging signal and would not confirm a move toward $90,000 on its own.
Bitcoin-to-Gold Ratio Points to a Possible Liquidity Shift
Bitcoin’s performance relative to gold is another development as the first full week of October begins. The BTC/XAU ratio, which measures Bitcoin’s value against gold, ended the third quarter more than 37% higher, its strongest quarterly gain since the final quarter of 2024.
The ratio is now approaching another important technical breakout level following a rotation that began around mid-August.
A continued rise would indicate Bitcoin outperforming gold and could support the case for improving demand for BTC.
However, relative outperformance alone does not prove that investors are directly selling gold to purchase Bitcoin.
The macroeconomic backdrop also remains complicated. Softer inflation and weaker employment data have reduced expectations for another near-term Federal Reserve rate increase, but elevated Treasury yields continue to constrain broader risk appetite.
For Bitcoin, a stronger BTC/XAU ratio, paired with a confirmed break above $88,000, would provide a more convincing bullish signal than either development in isolation.
Can ‘Uptober’ Push Bitcoin Toward $90K?
October has historically produced positive returns for Bitcoin more frequently than negative ones, contributing to the market’s familiar Uptober narrative.
BTC also enters Q4 following a strong Q3 recovery. However, its early October performance has been uneven, with buyers struggling to maintain gains above $85,000 despite improving sentiment.
US spot Bitcoin exchange-traded funds (ETFs) attracted approximately $102.7 million in net inflows on October 1, providing additional support following September’s strong institutional demand.
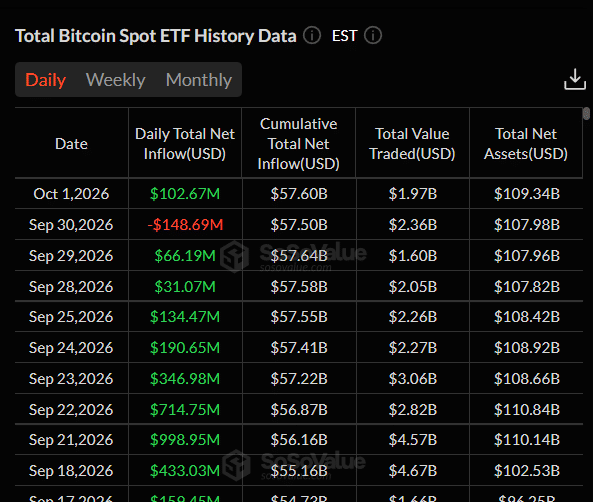
The more immediate question is whether those inflows, together with improving futures activity, can absorb selling between $86,000 and $88,000.
A confirmed breakout would make $90,000 a reasonable next technical level. Historical October performance alone is not sufficient evidence to project that move.
$82K Remains Bitcoin’s Main Short-Term Support
On the downside, the immediate support sits around $83,800 to $84,000, where Bitcoin recently stabilized after its rejection.
The stronger level remains between $82,000 and $82,500, corresponding to the lower boundary of the current four-hour consolidation.
A sustained break below $82,000 would weaken the short-term recovery and increase the likelihood of a deeper pullback toward $74,000 to $78,000, an area that previously supported Bitcoin before its latest advance.
Below that zone, approximately $66,000 remains a deeper structural reference from the earlier recovery.
The $82,000 level is therefore the immediate invalidation point for the current range, while $74,000 to $78,000 determines whether a larger correction can still find support within the broader recovery.
| Scenario | What Would Support It | Levels to Watch |
| Bullish Case | BTC reclaims $86K and records a confirmed daily breakout above $88K | $90K, then $95K-$96K |
| Base Case | BTC holds $82K but continues facing selling below $88K | $82K-$88K consolidation |
| Bearish Case | BTC loses $82K with sustained selling pressure | $74K-$78K, then $66K |
Table 2. Bitcoin Bullish, Base and Bearish Scenarios
Bottom Line
Bitcoin remains near $84,700, with improving futures demand supporting the recovery but sellers still controlling the $86,000 to $88,000 resistance area.
The immediate upside trigger is $86,000. A confirmed daily close above $88,000 would strengthen the case for $90,000, followed by the broader $95,000 to $96,000 resistance zone.
On the downside, $82,000 remains the main level to defend. Losing that support would increase the risk of a deeper correction toward $74,000 to $78,000.
This article is for informational purposes only and does not constitute financial advice. Crypto price predictions are based on analyst estimates and are not guarantees of future performance. Do your own research before making any investment decisions.
Frequently Asked Questions
Need a refresher? Here are the questions most readers ask about Bitcoin’s current price setup and October outlook.
What Is Bitcoin’s Main Resistance Right Now?
Bitcoin faces immediate resistance near $86,000, followed by the more important $87,000 to $88,000 region. A confirmed breakout above $88,000 would bring $90,000 into focus.
What Is Bitcoin’s Main Support?
Immediate support sits around $83,800 to $84,000, while $82,000 to $82,500 is the main short-term support zone. A drop to $82,000 could expose $74,000 to $78,000.
Could Bitcoin Reach $96,000 in October?
A move toward $96,000 remains a conditional bullish scenario. Bitcoin would first need to break above $86,000, establish a daily close above $88,000 and sustain momentum through $90,000.
What Does Positive Bitcoin Futures Taker CVD Mean?
Positive Futures Taker CVD indicates that aggressive futures buying is exceeding aggressive selling over the measured period. It can support bullish momentum, although rising CVD without a corresponding price breakout may indicate that sellers are absorbing demand.
Can Bitcoin Benefit From Outperforming Gold?
A rising BTC/XAU ratio indicates that Bitcoin is gaining value relative to gold. Continued relative strength could support market sentiment and the case for a move toward $90,000, particularly if accompanied by stronger spot demand and a confirmed technical breakout.



Be the first to comment