



Fidelity’s Jurrien Timmer sees Bitcoin reaching $300,000 in 2029, with its recovery around $60,000 supporting his view that a new bullish cycle may have begun.
Key Takeaways
- Timmer’s target rests on Bitcoin’s historical growth model.
- His gold-relative indicator has moved above zero.
- $60,000 remains central to his cycle assessment.
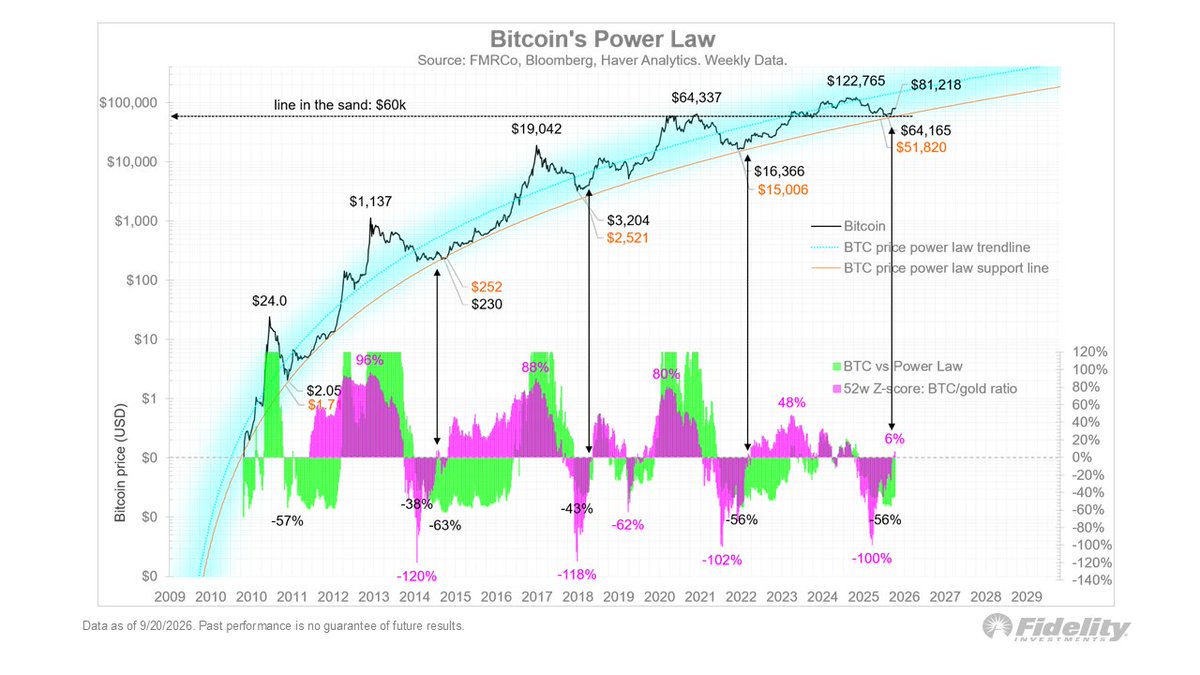
The Fidelity director of global macro outlined the target in a post accompanying his power-law chart, saying its mathematics suggests “a new cyclical bull market is underway after holding $60k, targeting $300k in 2029.”
Bitcoin traded near $85,000 at the time of writing, 08:00 UTC on October 4, 2026, according to CoinMarketCap. From that price, Timmer’s $300,000 target implies approximately 253% upside, equivalent to about 3.53 times the starting price. The figure reflects his model-based outlook; the post does not establish an official firm-wide Fidelity target or assign a probability to reaching it.
How the historical curve leads to a future target
Timmer’s power-law framework fits a relationship between Bitcoin’s price and time, then projects that relationship forward. It gives him a way to compare successive cycles against a longer-term growth path, even though their dollar values differ dramatically.
The chart’s logarithmic price scale makes that comparison possible: a tenfold increase occupies the same vertical distance whether Bitcoin rises from $1,000 to $10,000 or from $10,000 to $100,000. Its black price line shows the actual weekly observations, while the turquoise curve represents the fitted trend and the orange curve marks a lower support boundary.
These curves are Timmer’s reference for judging where Bitcoin sits within its history. The accompanying chart ends on September 20, 2026, with a price label of $81,218, so it should be read separately from the $84,500 baseline used above.
Reading the chart’s lower indicators
- Green bars: price versus the model
- They show Bitcoin’s deviation from its power-law trend. A negative value means price is below the fitted path, rather than measuring the loss from a previous peak.
- Magenta series: Bitcoin versus gold
- The 52-week Z-score compares the Bitcoin-to-gold ratio with its recent history. Its percentage labels belong to the indicator, rather than representing Bitcoin returns or a correlation coefficient.
The $60,000 threshold connects his earlier and latest views
During Fidelity’s earlier Q1 review and Q2 outlook, Timmer described Bitcoin as being in an accumulation or price-discovery phase. He said a strong break below $60,000 would concern him because it could suggest that the established growth relationship was changing.
His later post interprets the recovery after that area held as the start of another bullish cycle. The accompanying chart labels a recent weekly low at $64,165 and an orange support-curve point at $51,820. Those annotations distinguish the observed price from the model’s lower boundary; Timmer’s roughly $60,000 threshold is his separate reference for assessing the cycle.
Keeping those distinctions clear matters when judging a setback. A brief fluctuation around his threshold would be different from the sustained breakdown he previously described as concerning. The orange curve also changes over time, so its labelled value should not be treated as a fixed trading floor.
Gold provides a second comparison, not a second source of demand
The magenta indicator has moved above zero, with its latest label at 6% after a trough near -100%. That recovery shows Bitcoin’s position against gold improving relative to the indicator’s recent history, adding support to Timmer’s interpretation of a changing cycle.
A similar relative-performance question appears in Cathie Wood’s Bitcoin-versus-gold argument. The ratio can rise because Bitcoin gains, because gold falls, or because Bitcoin declines less than gold. It can therefore improve even while a Bitcoin holder loses money in dollar terms.
This helps explain why relative strength is useful but incomplete evidence for a dollar-price target. Timmer’s model and gold comparison both draw on market prices. Their agreement does not identify new buyers or demonstrate that investors have sold gold to purchase Bitcoin.
The target needs evidence beyond a fitted curve
The key assumption is that Bitcoin’s historical growth relationship remains relevant through 2029. Timmer acknowledged in the earlier Fidelity discussion that such patterns can end when the underlying technology is disrupted. Extending the curve is therefore conditional on a relationship continuing to hold, rather than establishing what the market must deliver.
That makes observed demand important alongside the model. Persistent net inflows into spot Bitcoin ETFs could help assess buying through one channel, while evidence of broader adoption could show whether demand was expanding elsewhere. ETF flows alone would not identify every buyer, establish their motives or capture purchases outside those funds.
| Price recovery | Whether Bitcoin preserves the recovery around Timmer’s cycle threshold. |
|---|---|
| Relative strength | Whether its improved position against gold persists. |
| Buying demand | Whether flows and adoption provide evidence beyond the two price comparisons. |
A sustained loss of the recovery zone would challenge Timmer’s new-cycle reading. Conversely, buyers continuing to support Bitcoin through subsequent setbacks would give it more substance. Those developments would help readers assess whether the market was following his proposed path well before 2029 arrives.
This article is for informational purposes only and does not constitute investment advice. Price targets are uncertain, and historical market relationships may change.



Be the first to comment