



Key Takeaways
- Bitcoin fell from $85,341 to $83,790 between 01:45 and 02:10 UTC on Oct. 7.
- Onchain trackers counted $412.62 million in liquidations in one hour, with longs making up over 97%.
- Coinglass mapped the next big liquidity pool near $82,600, about $1,600 below today’s price point.
The 20 Minutes
The descent started quietly at 01:45 UTC on Oct. 7, with a fifteen-minute stretch seeing BTC slip as low as $83,577, a drop of roughly 2.1% with almost no bounce in between.
Some analysts put the one-hour total at $412.62 million, with short liquidations at just $11.79 million, meaning longs took more than 97% of the damage. Over 24 hours, long liquidations reached $479 million, and 104,836 traders were liquidated in total.
The decline spread to the rest of the market at the same time as ether fell from about $2,688 to a low of $2,591, and XRP slid from $1.49 to $1.43 before both recovered slightly. A Coinglass market board posted shortly after showed nearly every top-20 asset in the red on the day, with UNI down 8.35% and Dogecoin down 4.62%.
Individual losses were also quite steep, with Lookonchain spotting a trader losing an entire 3,728 ETH long, worth $9.85 million, in about three minutes as ether broke below $2,600. The account also flagged that, just before the drop, four newly created wallets deposited $1 million USDC into Hyperliquid and opened 40x shorts on 148.49 BTC, worth about $12.5 million.

Whether that was luck, skill or advance knowledge is unproven, but it adds to a week in which large short positions on Hyperliquid have drawn scrutiny, including the $1.58 billion in shorts held by two linked accounts.
The Date Everyone Is Watching
The flush landed three days before Oct. 10, a date traders now treat almost like a holiday in reverse. On Oct. 10, 2025, a tariff shock triggered the largest liquidation event in crypto history, wiping out more than $19 billion in leveraged positions held by over 1.6 million traders across roughly 24 hours.
Wednesday’s event was nowhere near that scale, and the $479 million in long liquidations equaled just 2.5% of the 2025 total, and the 104,836 traders affected are roughly 6.5% of that day’s count. It was also smaller than last week’s shakeout, when bitcoin’s price dipped below $83k, and 129,197 traders were wiped out.
Still, the comparison spread fast on social media, and anniversaries have a way of shaping positioning. Traders who remember how quickly last year’s crash unfolded may keep leverage lighter into the weekend, which could dampen the next move or simply delay it.
Where Is Bitcoin’s Price Sitting Now
As things stand, bitcoin is trading near $84,200, still about $2,500 below its 24-hour high of $86,699. The past week has been a fight around the $87,000 ceiling, with the asset’s price pounding the $87K wall yesterday before sellers took control overnight.
The liquidation map points to the next pressure points, with a one-week heatmap posted hours before the drop showing heavy leverage clustered at $87,400 above and $82,600 below. Wednesday’s low stopped about $1,000 short of that lower pool, which means a large block of long liquidations is still sitting underneath the market.
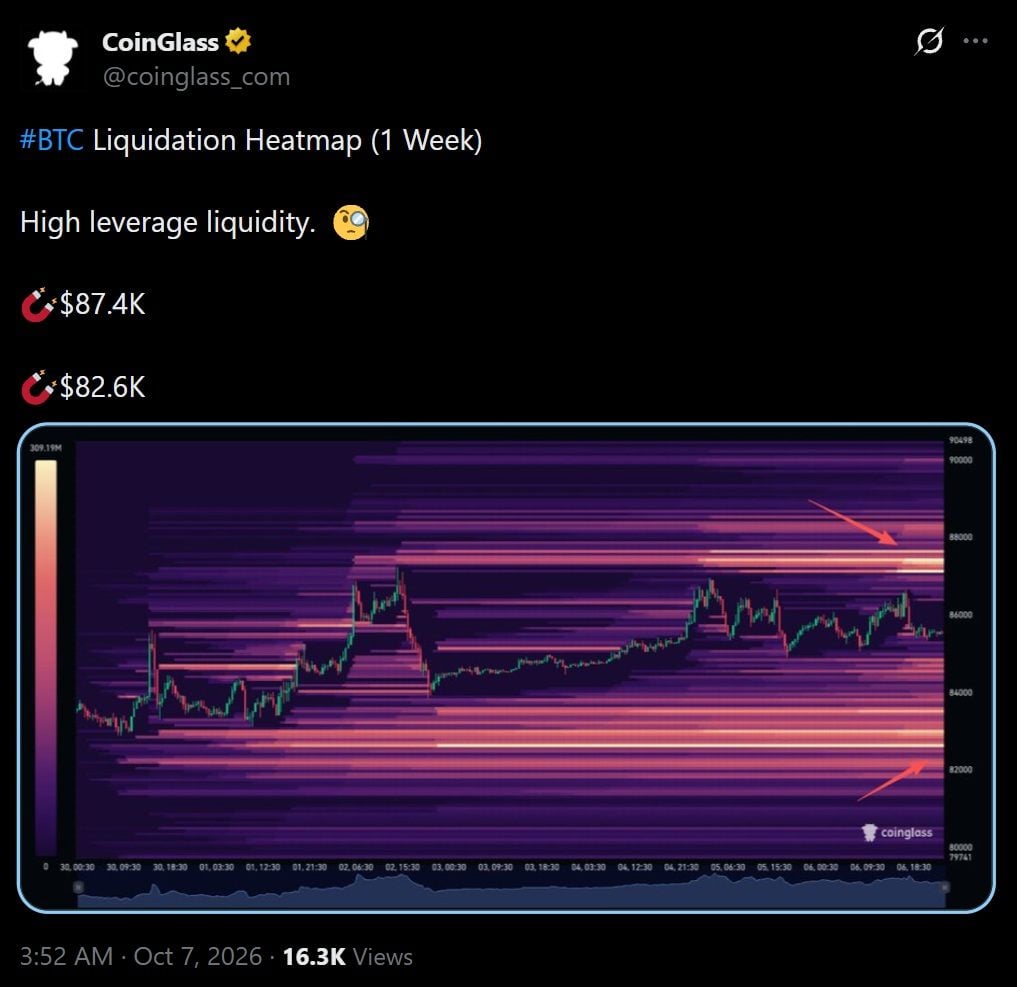
Three levels now are important to watch out for over the next couple of days:
- $83,577: Wednesday’s low and the line bulls need to hold.
- $82,600: Where Coinglass shows the next dense cluster of long liquidations.
- $87,400: The overhead liquidity pool that would squeeze shorts if bitcoin can reclaim it.







Be the first to comment