




TLDR
- DOGE is trading near $0.090, down more than 5% this week.
- The long-to-short ratio fell to 0.68, a one-month low, pointing to bearish trader positioning.
- Price sits below the 200-day EMA at $0.093, a sign of weak near-term momentum.
- A broadening wedge pattern on the daily chart points to a possible 20% drop toward $0.076.
- Memecoin dominance versus the broader altcoin market has dropped to a record low of 2.7%.
Dogecoin (DOGE) is trading around $0.090 on Wednesday. The token has fallen more than 5% this week. The drop adds to a longer correction that started in late September.
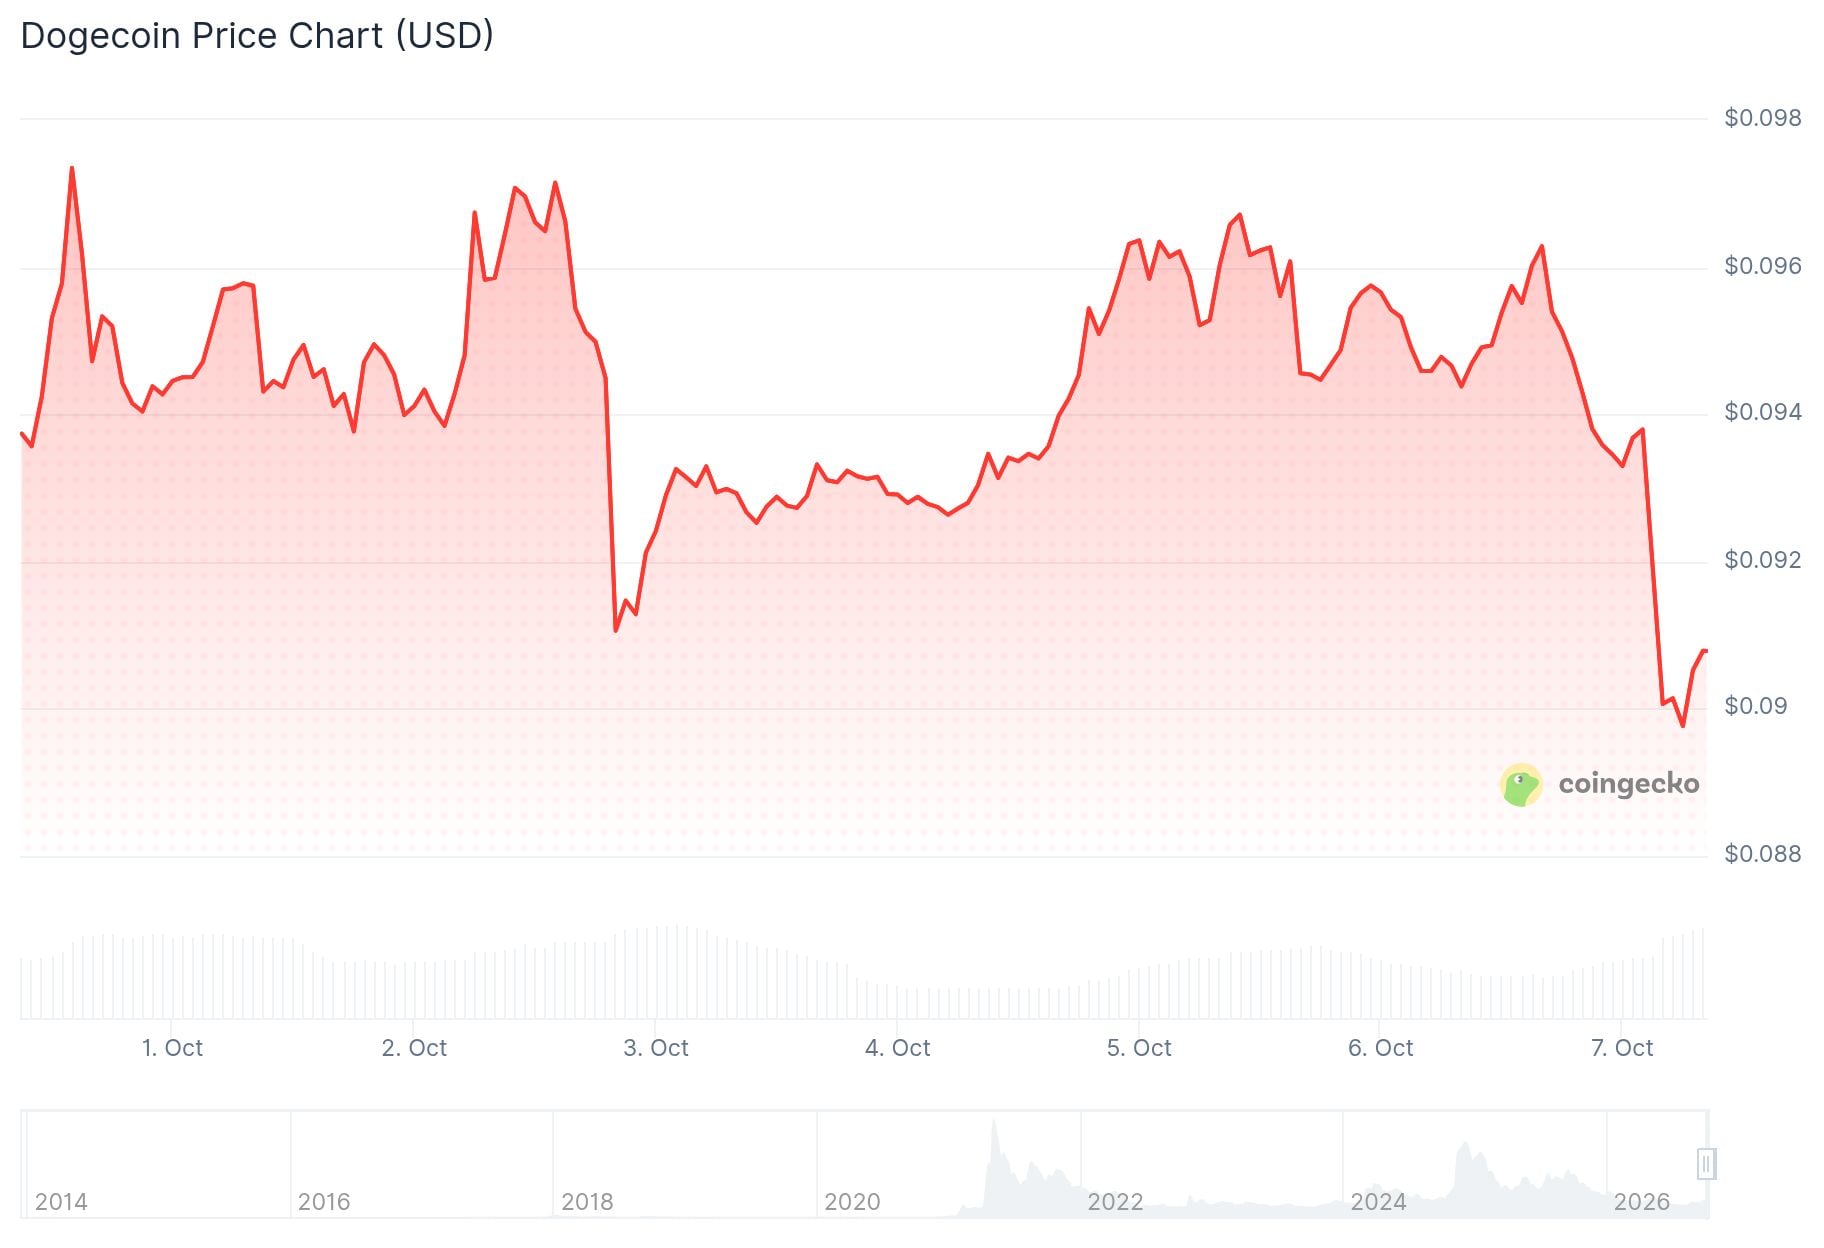
Short positions on DOGE have climbed to a one-month high. CoinGlass data puts the long-to-short ratio at 0.68. A reading below 1 shows more traders betting on a price drop.
CryptoQuant data points to the same bearish mood. Both spot and futures markets show signs of overheating. Large whale orders in futures are leaning toward sell-side activity.
Technical Indicators Show Weakening Momentum
DOGE remains below its 200-day Exponential Moving Average, which sits at $0.093. The price is still holding above the 50-day EMA at $0.088 and the 100-day EMA at $0.086.
The Relative Strength Index sits near 48 on the daily chart. The MACD line is slightly negative. Both readings point to fading momentum.
Support lines up near $0.088, where the 50-day EMA meets a horizontal level. The 100-day EMA at $0.086 sits just below that. A close under $0.085 could open the door to $0.070.
On the upside, DOGE needs to clear $0.093 to ease the bearish pressure. The next resistance sits near $0.102. Sellers have shown up at that level before.

Analyst Trader Tardigrade, who posts as @TATrader_Alan, flagged a familiar pattern forming on the 8-hour chart. The analyst said DOGE is printing lower highs near the same swing-high zone as its last downturn.
$DOGE/8-hour 🔥
❇️ Always prepare for the SSL Sweep during an uptrend.#Dogecoin is now forming a structure very similar to the last one. Lower highs, supported by the previous swing high zone again and again.
Price is being pushed back toward the recent low. That low is the… pic.twitter.com/tXSlEJVjJg
— Trader Tardigrade 🧬 (@TATrader_Alan) October 7, 2026
The analyst pointed to the recent swing low as the target for a liquidity sweep. A rejection there would open the door to another high. Acceptance below that level would push DOGE back into a sideways range.
Memecoin Sector Dominance Slides to Record Low
A separate chart pattern adds to the bearish case. DOGE’s daily chart shows an ascending broadening wedge. The pattern forms when price swings widen between two upward sloping lines.
The wedge’s upper line extends toward $0.11. The lower support line sits between $0.090 and $0.092. A break below that zone could send price toward $0.0871.
That level matches the 0.5 Fibonacci retracement of the recent rally. A deeper slide could reach $0.0828, the 0.618 Fibonacci mark. The $0.076 to $0.077 zone, tied to the 0.786 retracement, represents close to a 20% drop from current levels.
The daily RSI on this chart has cooled to 57, pointing to softening bullish momentum. A recovery above $0.1055 and a break of the wedge’s upper line would weaken the bearish case.
CryptoQuant analyst Darkfost reported that memecoin dominance against the broader altcoin market has dropped to about 2.7%. That is the lowest level on record for that measure. The figure shows how far memecoins have fallen behind other altcoins.
I’m getting ahead of Antifragile to show you this chart, which lets you visualize just how extreme the asymmetry between memecoins and altcoins has become.
The ratio between memecoin market cap and altcoin market cap has hit its lowest level yet, at 0.027.
In other words,… https://t.co/nTlJ8YZRH2 pic.twitter.com/HbJ53VcKDv
— Darkfost (@Darkfost_Coc) October 5, 2026
A growing number of memecoins has spread trading volume across more tokens. That has made it harder for the sector to attract concentrated demand.
DOGE was trading near $0.0952 on October 6 before slipping further. The token failed to hold above $0.10 after its late-September rally. As of Wednesday, DOGE sits at $0.09085, down 3.93% over the past day according to live pricing data.



Be the first to comment