



Bitcoin (BTC) dipped below $84,000 on Wednesday as flash downside liquidated over $500 million in crypto long positions.
Key points:
- Bitcoin briefly dropped to $83,560 but held support at its 21-day moving average, which currently stands at $83,850.
- Analysis flagged 40x-leveraged BTC shorts on Hyperliquid appearing immediately before the downside ensued.
- Analysis by Rekt Capital viewed a daily or three-day close above $86,700 as necessary to confirm upside continuation.
Hyperliquid shorts in focus after BTC price drop
Data from TradingView showed BTC/USD falling up to 2.3% over two hourly candles before returning to circle $84,000 at the time of writing.
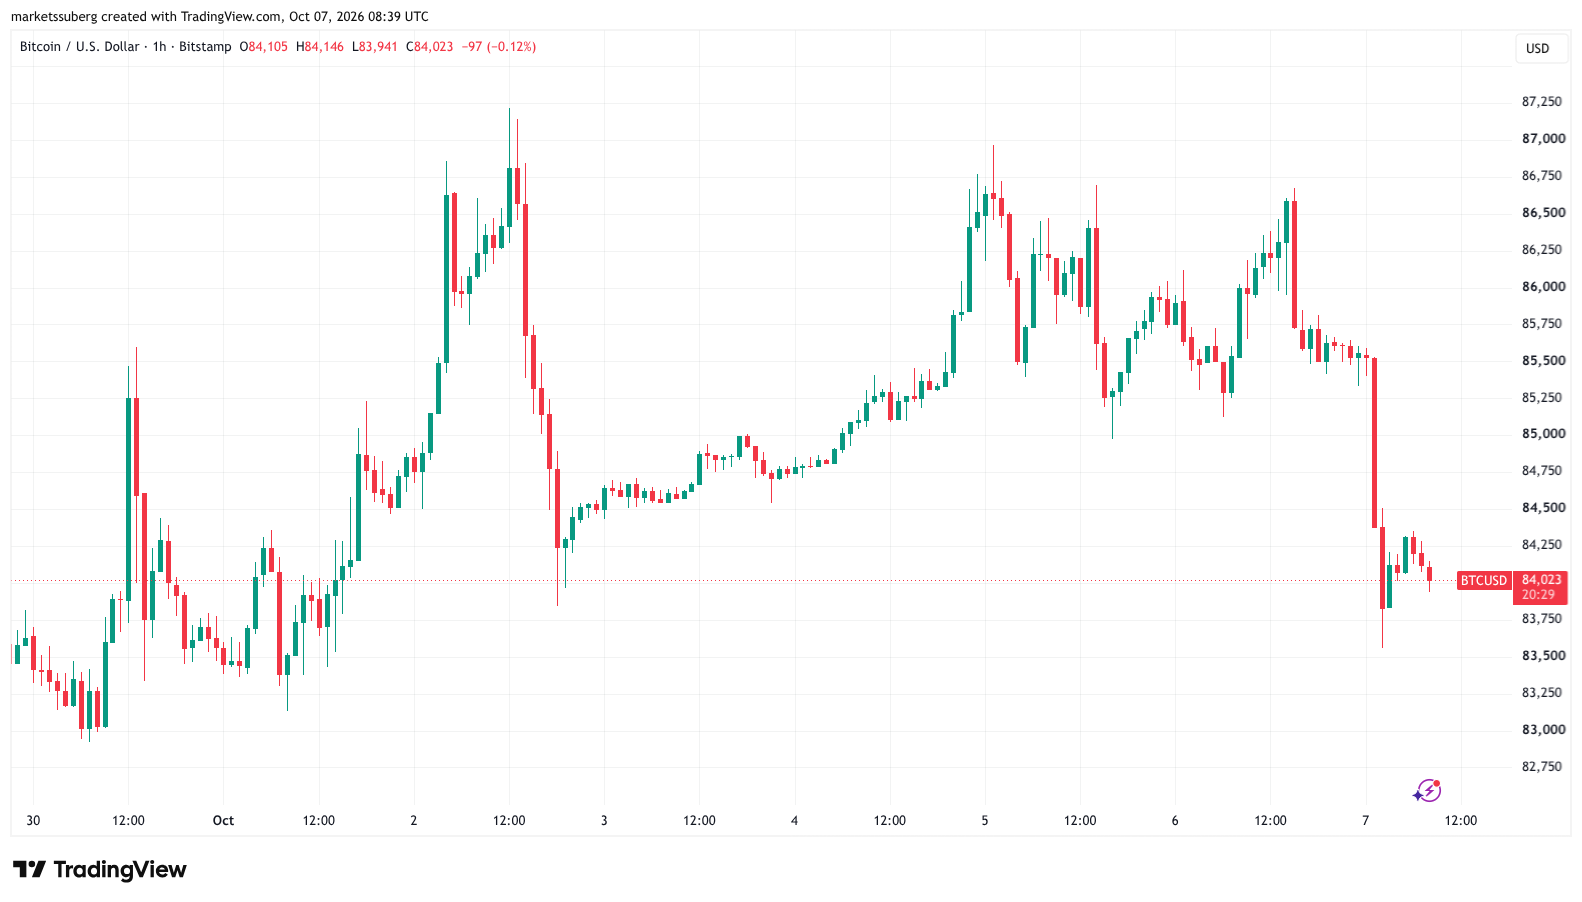

BTC/USD one-hour chart. Source: Cointelegraph/TradingView
The move came after overhead ask liquidity thickened on exchange order books, keeping spot price from rising past $86,500 on Tuesday. Cumulative 24-hour crypto long liquidations hit $550 million, per data from CoinGlass.
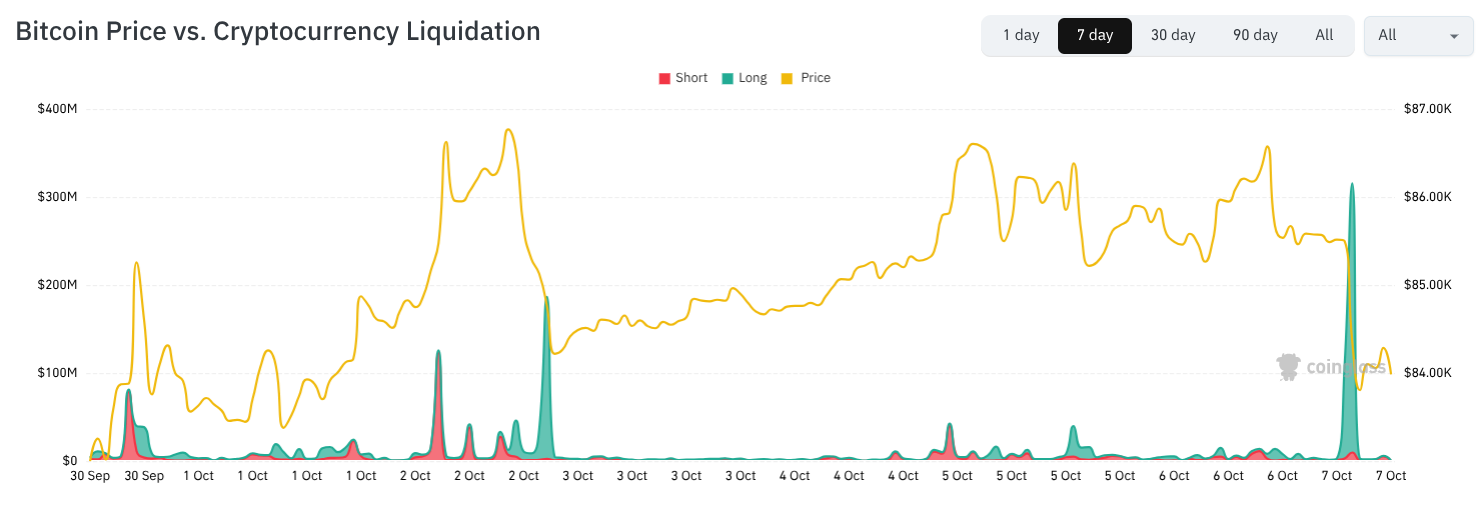
BTC/USD vs. crypto liquidations (screenshot). Source: CoinGlass
Just before the overnight drop, four wallets used stablecoin USD Coin (USDC) to open shorts on 148.49 BTC with 40x leverage on Hyperliquid, onchain data from Lookonchain and others reveals.
After the long position flush, open interest (OI) immediately began to rebound across the 21 exchanges tracked by CoinGlass — potentially a sign that traders were comfortable with increasing BTC exposure at the local lows. OI increased from around $54.2 billion to $55.3 billion over six hours between 4 a.m. and 10 a.m. UTC.
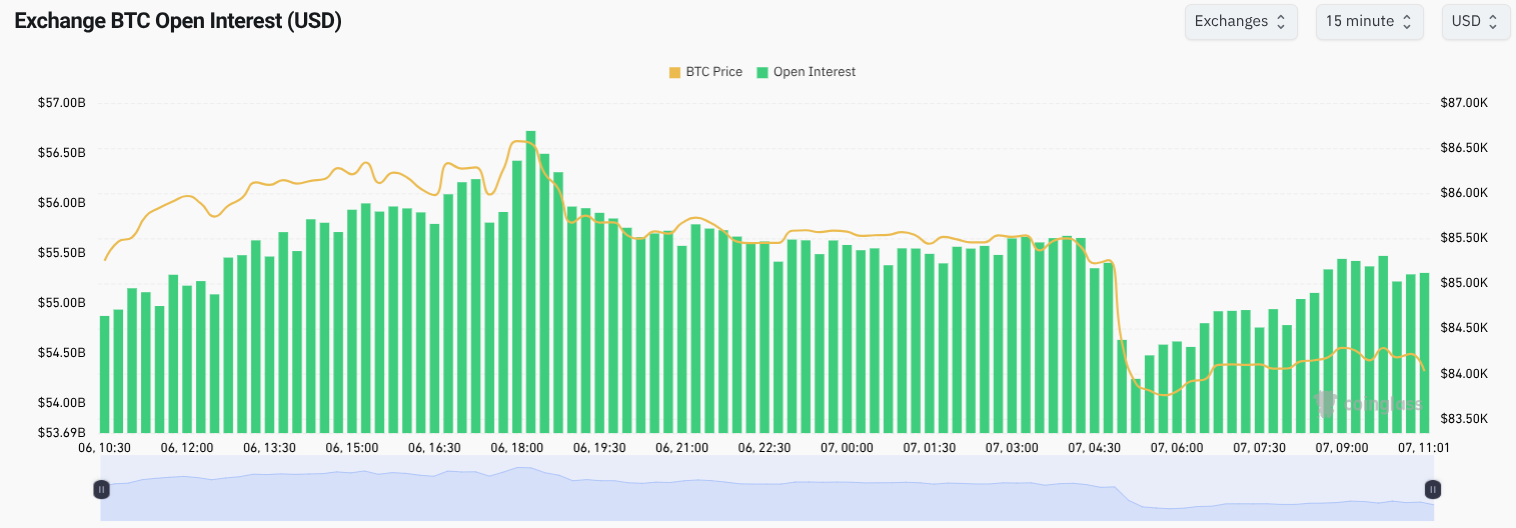
BTC exchange OI data (screenshot). Source: CoinGlass
Bitcoin preserves nearby support levels
Despite trading 1.8% lower on the day, Bitcoin preserved nearby support in the form of its 21-day simple moving average (SMA) near $83,850. Previously, Cointelegraph reported that this level forms a line in the sand for bulls on low time frames.
Related: Binance BTC outflows hit highest since mid-2023 as whales deposit stablecoins
Below this trend line, $82,500 remains as a decisive area for Bitcoin’s broader uptrend. It forms a key level as part of an inverse head-and-shoulders reversal pattern, which is still playing out on the weekly chart. Price last visited the level on Sept. 28.
In his latest market commentary, trader and analyst Rekt Capital explained that a daily candle close above $86,700 would be required to maintain a bullish setup.
“At the moment, Bitcoin is lacking that lower timeframe confirmation relative to this key level for continuation,” he told X followers on Tuesday.
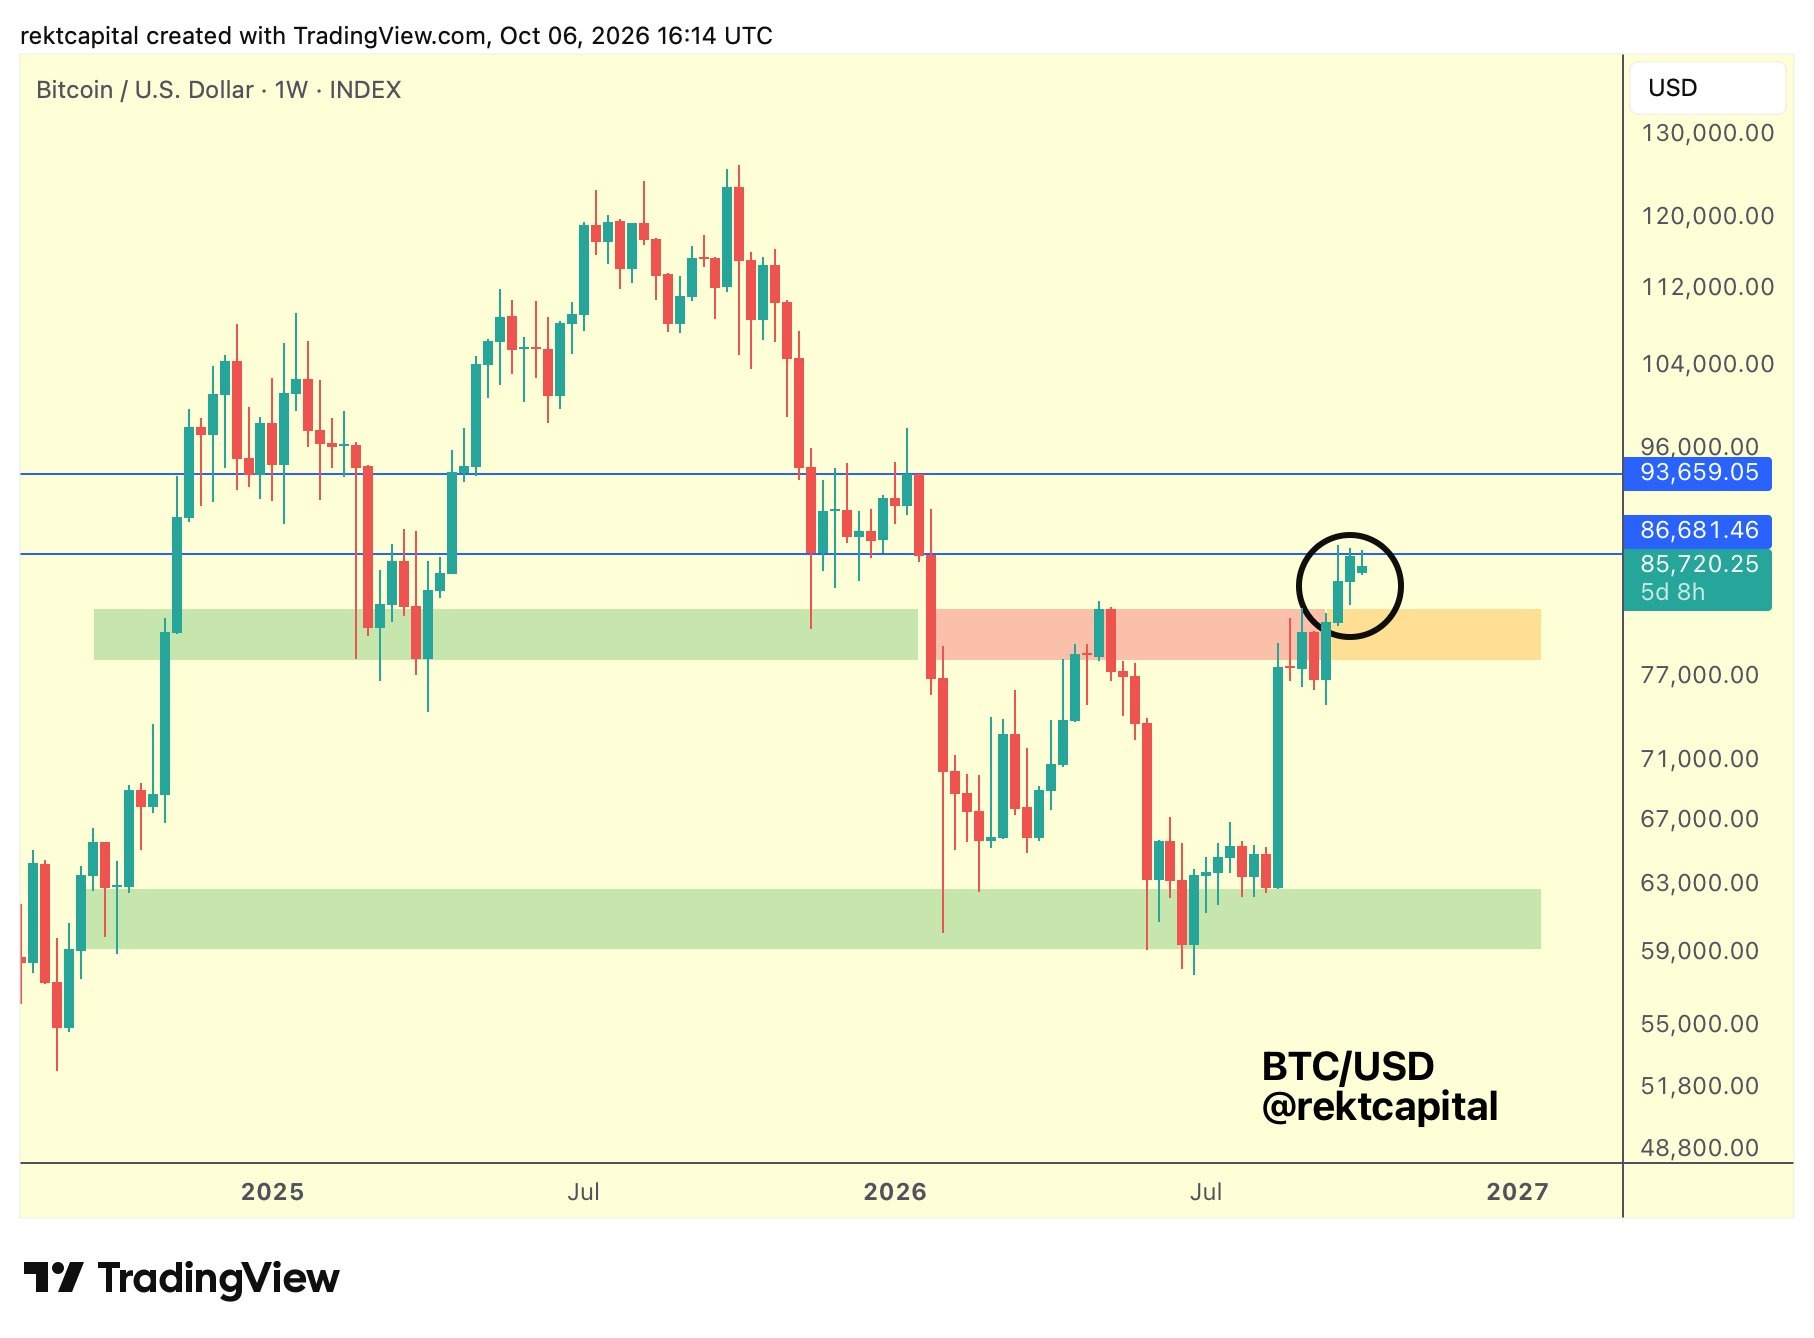
BTC/USD one-week chart. Source: Rekt Capital on X.com



Be the first to comment