


Chainlink’s pullback has brought LINK back to a September breakout shelf near $13.20. Santiment’s data suggests that new Ethereum-mainnet participation barely expanded during the preceding rally.
Key Takeaways
- LINK has fallen below $13.80 and is testing the $13.10-$13.30 support zone.
- Santiment recorded a 24% price rise alongside less than 2% growth in average daily new LINK addresses.
- The first deeper support cluster sits near $12.40-$12.65.
- LINK needs to recover $13.75-$14 to ease pressure on the short-term structure.
$13.20 has become LINK’s immediate test
LINK traded near $13.36 at 11:48 UTC on October 7, down 4.28% on the day. The decline returned price to the area where September’s advance first began to hold above earlier resistance.
The Fibonacci range from September’s $10.6 low to the late-September high of $15.7 places the 0.382 retracement at $13.80. LINK had closed around or above that level during several recent sessions, even though lower wicks had already crossed it. The latest move has left $13.80 behind, placing more importance on whether buyers can hold the next support band.
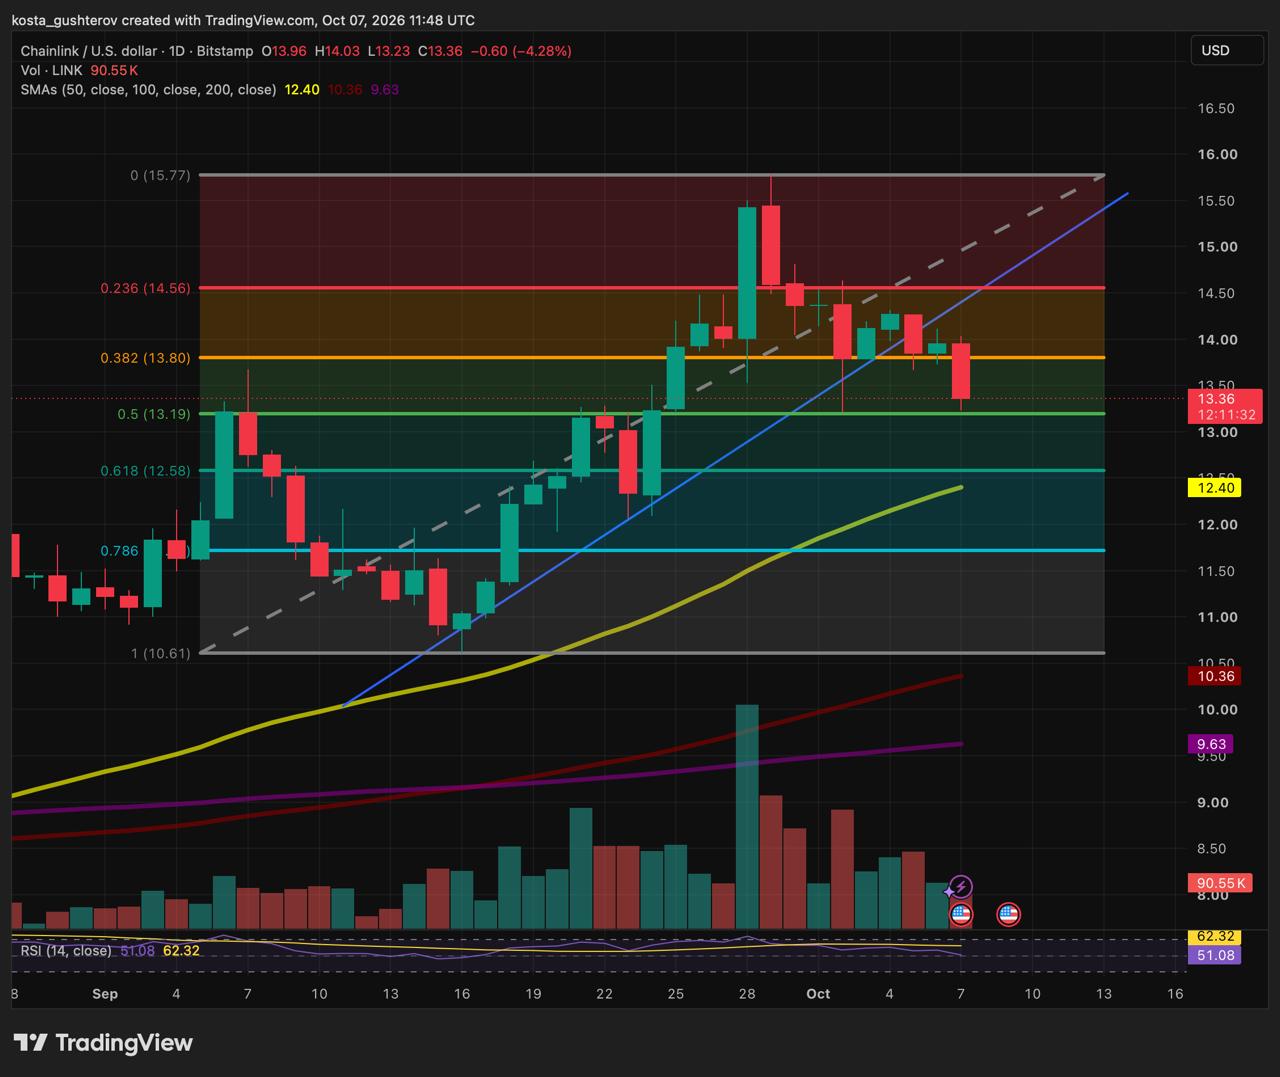
That band runs from $13.10 to $13.30 and is centred on the 50% Fibonacci retracement near $13.19. LINK’s low of $13.23 has already reached it. Price also paused around this range during September before later moving higher, while an early-October pullback drew buyers back to the same neighbourhood.
Those earlier reactions give the zone more meaning than a calculated retracement alone. Former resistance can become support when buyers continue accepting higher prices after a breakout, a relationship explained in Fidelity’s guide to support and resistance. The daily close and the sessions that follow will show whether that role still holds.
Momentum has weakened alongside price. Daily RSI is near 51 and below its smoothing line at 62, while LINK has also slipped beneath the steep rising trendline. Together, those readings leave the latest leg of the rally less secure just as price reaches its first important support test.
New LINK addresses barely grew during the rally
Santiment reported that LINK rose from $11.22 to $13.96 between the September 1 and October 6 closes, a gain of roughly 24%. Average daily new LINK addresses reached 1,249 in the four weeks to October 6, compared with 1,225 in the four weeks to September 1 – an increase of fewer than 2%.
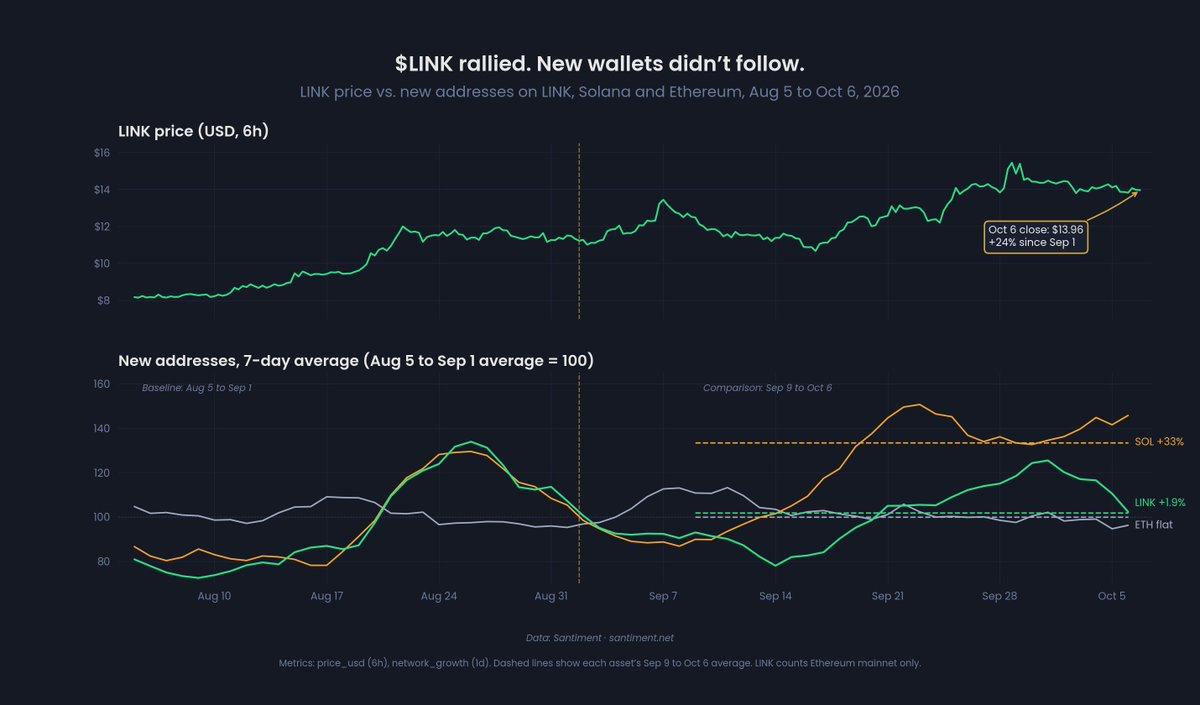
The price move therefore did not come with a comparable expansion in first-time Ethereum-mainnet participation. That does not mean LINK lacked demand. Existing holders, large wallets, exchange activity and trading outside Ethereum can all influence price without producing a large increase in new LINK addresses.
Santiment’s network-growth metric counts addresses transferring LINK for the first time, rather than unique investors or the value of their purchases. Its series covers Ethereum mainnet and excludes cross-chain activity and ETF exposure. Chainlink also presents a separate case: demand for its oracle services can grow through integrations without creating a matching rise in first-time token transfers.
The address data cannot decide whether $13.20 holds, but it does add context to the pullback. LINK is testing the breakout area after a rally that did not bring the same growth in first-time mainnet addresses, leaving price behaviour at support more important than the headline gain alone.
The support map below $13.20
If LINK closes below the $13.10-$13.30 area and fails to regain it, the chart provides three lower zones to monitor:
- $12.40-$12.65
- The 0.618 Fibonacci retracement near $12.58, the rising 50-day SMA near $12.40 and September price reactions overlap here.
- $11.60-$11.85
- The 0.786 Fibonacci retracement near $11.71 and an earlier September consolidation area.
- $10.35-$10.65
- September’s swing low near $10.61 and the 100-day SMA near $10.36.
A move into the first lower cluster would slow the recovery, though the broader structure would remain intact while LINK stays above its 50-day, 100-day and 200-day averages. Those moving averages sit well below the current price, so they offer little help in deciding the immediate contest around $13.20.
LINK needs $13.80 back before the pullback looks contained
LINK would need to regain $13.75-$14.00 and hold there before buyers could argue that the pullback has been absorbed. That recovery would bring $14.20-$14.60 into view, where recent lower highs overlap with the 0.236 retracement near $14.5. The larger ceiling remains between $15.40 and $15.7.
A clearer rise in first-time LINK address activity during any recovery would offer a useful second check on its strength. Until then, the market’s immediate answer lies at $13.10-$13.30: holding that range would preserve September’s breakout shelf, while losing it would widen the pullback toward the lower support clusters.
This article is for informational purposes only and does not constitute investment or trading advice. Technical levels and network metrics can change quickly and do not guarantee future price movements.

Alex is Editor-in-Chief of Coindoo and co-founder of Millennial Media Group, with nearly a decade of experience covering financial markets – crypto first, then everything else.
It started in 2016 with Bitcoin. Like most people at the time, he didn’t fully understand it – so he kept digging. Blockchain, tokenomics, the projects, the cycles. That curiosity never stopped, and eventually pulled him into traditional markets too: equities, commodities, macro. Not because he left crypto behind, but because you can’t properly understand one without the other.
What drives him is straightforward: he wants to know why something is happening, not just that it’s happening. Most market coverage stops at the headline – price up, price down, here’s a chart. Alex finds that kind of reporting actively unhelpful. If you walk away from an article without understanding the mechanism behind the move, what did you actually learn?
He holds a degree in Tourism from New Bulgarian University – not the most obvious path into financial markets, but markets have a way of pulling in people who are simply too curious to stay out. He has authored over 200 in-depth analyses and more than 10,000 articles across crypto and traditional finance. He still thinks every day in markets teaches him something new. That’s probably why he hasn’t stopped.



Be the first to comment