


XRP is testing the floor of a developing descending triangle near $1.46-$1.47 after its latest pullback. A daily close below it would shift attention toward lower supports.
Key Takeaways
- XRP is pressing against triangle support near $1.46-$1.47.
- $1.426-$1.43 is the first lower area to watch if that floor fails.
- The stronger downside confluence sits near $1.34-$1.35.
- A recovery through $1.49-$1.50 would weaken the bearish reading.
XRP has returned to the support under pressure
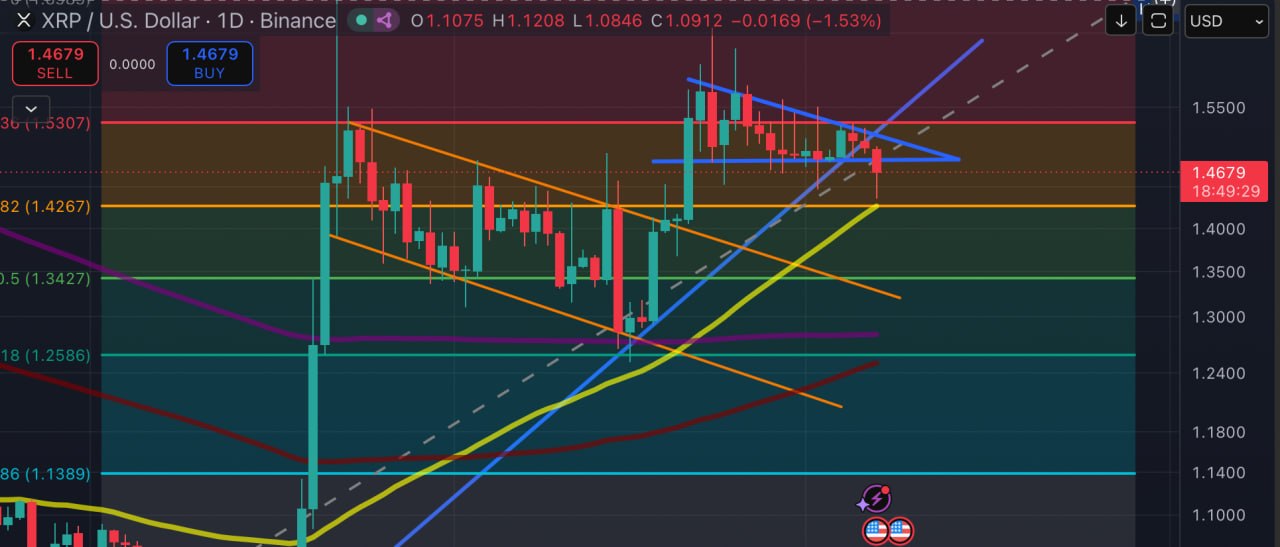
XRP traded near $1.467 on Binance’s daily chart at the time of writing, down about 1.5% on the still-open candle. That move has pushed price back to the lower edge of the recent blue formation, where buyers previously returned around $1.46-$1.47.
An intraday dip alone does not settle the test. A wick beneath support can reflect a failed attempt by sellers to push lower, whereas a daily close below $1.46-$1.47 would show that XRP finished the session beneath the level that contained recent pullbacks.
Lower rebound highs have formed a bearish-looking pattern
XRP’s rebounds have stopped at progressively lower points since the move toward the $1.55-$1.57 area. Buyers, meanwhile, have continued to defend a similar floor near $1.47. The two lines form a descending triangle that puts increasing attention on the lower boundary.
Descending triangles often lean bearish because repeated tests can weaken demand at the floor. XRP still needs to lose that area on a closing basis before the formation carries more weight than a short-term consolidation.
Support can still hold. A rebound that carries XRP back through the descending upper line would show that the latest sell-off has not taken control of the range.
$1.43 comes before the deeper $1.35 test
Even if XRP loses the current floor, the chart does not point directly to $1.35. The first lower area sits at $1.426-$1.43, where the 0.382 Fibonacci retracement may attract a reaction. That zone has already played an important role in the correction: XRP’s earlier channel breakout also left $1.40-$1.43 as the area buyers needed to protect during the first pullback.
The more consequential support zone lies around $1.34-$1.35. It combines the 0.5 Fibonacci retracement near $1.34 with the projected upper boundary of the orange descending channel that XRP broke above during its September recovery. A former channel ceiling can become support when price returns to it later.
- $1.46-$1.47
- The developing triangle’s lower boundary and the support under pressure now.
- $1.426-$1.43
- The 0.382 Fibonacci retracement near $1.42, which overlaps with the rising 50 SMA and marked the low of today’s pullback; the first lower area to watch if current support breaks.
- $1.34-$1.35
- The 0.5 Fibonacci level and the projected upper boundary of the former descending channel.
- $1.258-$1.26
- The deeper 0.618 Fibonacci retracement if the lower zones also fail.
The former channel boundary moves over time, unlike the horizontal Fibonacci levels. Its overlap with the 0.5 retracement gives the $1.34-$1.35 area more weight than either reference could carry on its own.
Buyers need more than a small bounce
If $1.46-$1.47 holds, the immediate downside case loses force, though XRP would still need more than a brief rebound to improve the chart. Recovering the descending resistance near $1.49-$1.50 would show that buyers are breaking the recent sequence of lower highs.
The horizontal resistance (0.236 Fib level) near $1.53 comes next. A close above it would place XRP back over the range that produced the triangle and make the lower-high pattern far less convincing.
XRP is now trading at the level that could determine whether the triangle remains a developing pattern or turns into a completed support break. A close beneath $1.46-$1.47 would shift attention toward $1.43 and then $1.35; a recovery through $1.49-$1.50 would show that buyers still have a route back into the range.
Chart source: TradingView, XRP/USD on Binance / October 7, 2026.
This article is for informational purposes only and does not constitute investment or trading advice. Technical levels are approximate and do not guarantee future price movements.

Kosta has reported on cryptocurrency markets and blockchain infrastructure since 2020, bringing over six years of hands-on experience in the crypto industry built through daily tracking of markets, trends, and emerging blockchain developments. Specializing in Bitcoin on-chain analysis, institutional ETF flows, and digital asset price action, his work at Coindoo has been cited by other news agencies and consistently covers market developments with a focus on data-driven reporting across Bitcoin, Ethereum, Solana, and XRP.
Over the years, Kosta has contributed to multiple crypto media outlets in different regions, authoring over 6,000 articles across the sector. His reporting spans cryptocurrency markets and the broader fintech industry, tracking not only price action but also the technological and regulatory forces shaping the ecosystem.
To support his analysis, Kosta actively leverages on-chain data and metrics from leading platforms such as Santiment, Glassnode, and CryptoQuant, enabling deeper, evidence-based market insights. He believes in the power of transparency and the data that underpins the blockchain ecosystem.
His academic background in Marketing Management from Denmark further complements his analytical approach, adding a strong understanding of communication strategy and content positioning to his work.



Be the first to comment