



Crypto Crash Reason Hunt: What Actually Happened Today?
The crypto market was deep in the red on Thursday afternoon, 8 October 2026, and almost nothing in the top 13 escaped. $Bitcoin is trading at $80,986, down 2.9% in 24 hours, 3.7% over seven days and now 7.5% below where it started the year. Total Bitcoin market cap has slipped to $1.62 trillion.
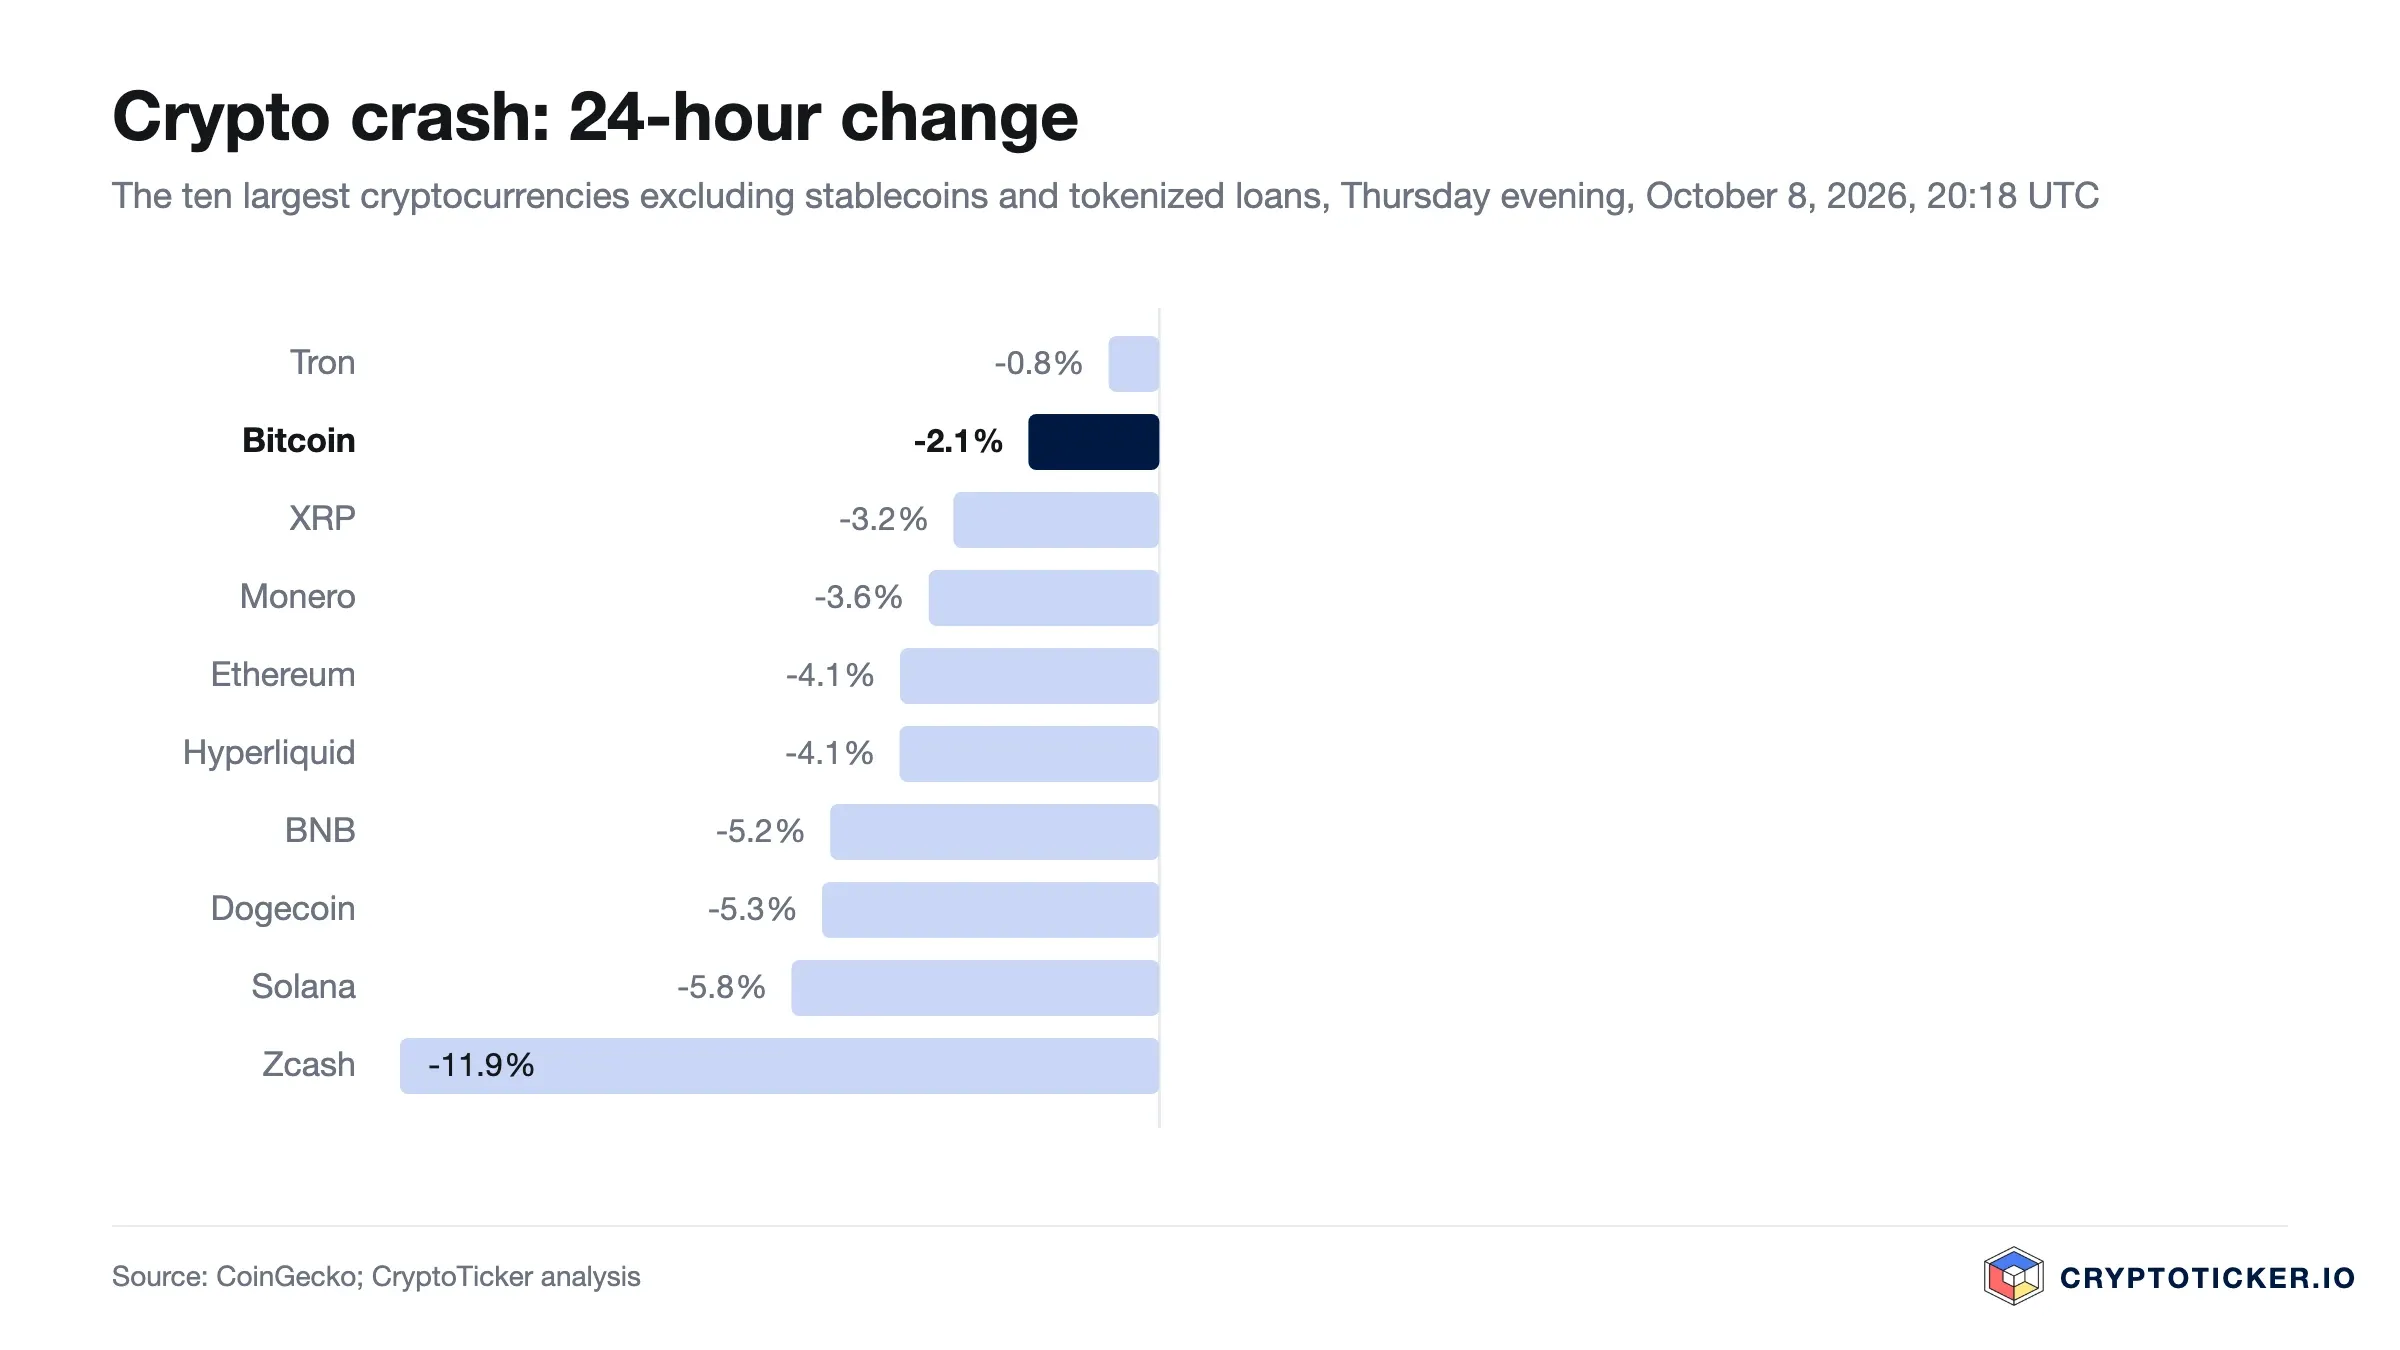
Altcoins took the harder hit. $Ethereum is at $2,432 after a 5.3% daily drop and a brutal 9.3% weekly slide, pushing its year-to-date loss to 18%. XRP is down 6.2% on the day and 27% for the year. Solana sits at $108, Dogecoin at $0.083, and Chainlink lost 7.9% in a single session. Even Zcash, the year’s breakout privacy coin, gave back 15.6% in 24 hours and 18.6% on the week, though it remains up 119% since January.
X Content Blocked
Please accept marketing cookies to view X (Twitter) embeds.

The only green on the board is the stablecoin pair, with USDT and USDC flat as expected. That pattern, with Bitcoin falling less than everything around it, is the classic signature of a risk-off rotation rather than a Bitcoin-specific problem. So what is the crypto crash reason this time? There is not one answer but three, and they stack on top of each other. You can track all of these prices live on the CryptoTicker crypto prices page.
Crypto Crash Reason #1: Did the Fed Just Kill the Rate Cut Dream?
The biggest crypto crash reason sits in Washington, not on a trading screen. The Federal Reserve raised its target range by 25 basis points to 3.75% to 4.00% on 16 September, and the minutes of that meeting landed on Wednesday, 7 October. The message was not what risk assets wanted to hear: most participants expect another hike to be appropriate before year-end, depending on incoming data.
That single line reframes the whole year. Markets had spent months treating the September move as a one-off. The minutes suggest it could be the start of a tightening cycle instead.
Higher rates hit crypto through two channels. First, Treasury yields rise, and a risk-free 4%+ return makes a volatile, zero-yield asset like Bitcoin less attractive by comparison. Second, the dollar strengthens, and Bitcoin has historically moved inversely to the greenback. Add elevated oil prices driven by renewed US and Iran tensions, which feed inflation expectations and reinforce the case for tighter policy, and you get the macro cocktail that pushed every asset on your screen into the red.
The next checkpoints are already circled: the US CPI print on 14 October and the FOMC meeting on 27 and 28 October. Until those pass, the market is trading the fear of a hike as much as the hike itself.
Crypto Crash Reason #2: How Did More Than $1 Billion in Leverage Get Wiped Out?
The macro news explains the direction. Leverage explains the speed. Bitcoin spent the first week of October trapped between $83,000 and $87,000, failing at the top of that range again and again. Each rejection stacked more leveraged long positions underneath the market, and traders kept betting on an Uptober breakout that never came.
According to CoinGlass, positions worth $1.16 billion were liquidated across the market in the 24 hours to 20:19 UTC on Thursday, meaning exchanges closed them by force. $1.05 billion of that, a little over 90%, were long positions betting on higher prices, and 191,736 traders were affected. $1.00 billion of the total came in the last twelve hours alone, so the wave more than doubled over the course of Thursday.
This is what traders call a leverage flush. The heaviest damage was in Ether: long positions worth $293.8 million were liquidated there, more than the $269.7 million in Bitcoin, even though the Bitcoin market is several times larger. The largest single liquidation was an ETH position on Hyperliquid worth almost $20 million. Open interest in futures fell 5.9% in 24 hours to $143.2 billion. Every forced closure pushes the price further into the next cluster of liquidation levels.
The timing adds a psychological layer. Saturday, 10 October, marks one year since the largest liquidation day in crypto history: on 10 October 2025, positions worth $19.16 billion were liquidated, according to CoinGlass. Traders remember it, and Thursday’s slide to an intraday low of $80,427 (CoinGecko) landed right before that anniversary.
Crypto Crash Reason #3: Why Are the ETFs Selling?
The third crypto crash reason is about who is on the other side of the trade. For most of 2026, spot Bitcoin ETFs have been the structural buyer that absorbed every dip. That bid has now reversed.
US spot Bitcoin ETFs recorded net outflows of $484.9 million on 7 October, or about 5,670 BTC, according to CoinGlass. BlackRock’s iShares Bitcoin Trust saw the largest outflow at about 2,430 BTC, followed by Fidelity with 1,230 BTC and ARK 21Shares with 1,190 BTC. Ether ETFs are bleeding too: they have recorded outflows on every trading day since 29 September, about 74,500 ETH on 6 October and about 59,700 ETH on 7 October. Figures for Thursday were not yet available on Thursday evening. When the institutional buyer steps back at the exact moment leveraged longs are being liquidated, there is nobody left to catch the falling knife.
None of these three reasons would have produced a crash on its own. A hawkish Fed with no leverage in the system is a slow grind. A leverage flush with ETFs still buying is a 20-minute wick that recovers. It is the combination that turned a pullback into Thursday’s broad-based selloff.

Crypto Crash Reason for Altcoins: Why Did Ethereum and XRP Fall Twice as Hard?
Look at the 24-hour column on your market table and a pattern jumps out. Bitcoin lost 2.9%. Ethereum lost 5.3%, XRP 6.2%, Solana 7.0%, Dogecoin 7.0%, Chainlink 7.9%. Almost every major altcoin fell roughly twice as far as Bitcoin, and the gap is even wider on the weekly and year-to-date numbers.
There are three mechanical reasons for this. Altcoins have thinner order books, so the same dollar amount of selling moves the price further. Altcoin perpetual markets carry proportionally more retail leverage, so liquidation cascades hit harder. And in a risk-off rotation, capital does not just leave crypto; it also consolidates within crypto, flowing from smaller tokens into Bitcoin and stablecoins first. Bitcoin dominance rises during a crash precisely because it is treated as the least risky crypto asset.
Ethereum carries an extra burden. ETH is now down 18% on the year while Bitcoin is down only 7.5%, and the ETH ETF outflows on Wednesday were proportionally larger than Bitcoin’s. XRP, down 27% year-to-date, has been losing the $1.50 battle for weeks and failed there again before this drop. For anyone looking for the altcoin-specific crypto crash reason, it is simple: altcoins never built the institutional floor that Bitcoin did, so when that floor cracks, they fall through it faster. Track the dominance shift on the CryptoTicker charts page.
Which Coins Are Beating the Crypto Crash in 2026?
Not everything on the board is a loser. Four names in the top 13 are still green on the year, and they tell you where the market’s conviction actually lives.
$Hyperliquid is the standout at +228% year-to-date, even after a 5.9% daily drop. HYPE is the native token of the dominant on-chain perpetuals exchange, and ironically a leverage flush is good for its business: more liquidations mean more fees.
$Zcash is up 119% in 2026 on the privacy coin revival, though it is also the most volatile name here with an 18.6% weekly drop, a reminder that what rallies hardest also corrects hardest.
$Monero, the other privacy heavyweight, is up 22% and fell just 2.2% on the week, the smallest decline of any non-stablecoin in the table.
$TRON rounds out the list at +17% and down only 0.7% on the day. TRX benefits from stablecoin settlement volume, which does not care whether the market is up or down, and that makes it behave like a defensive asset in a crash.
The common thread is clear. The coins that held up are the ones with real, measurable revenue or a strong narrative independent of Bitcoin’s price. The coins that fell hardest are the ones whose main story was “beta to Bitcoin.” That is worth remembering the next time someone asks what the crypto crash reason is for their particular bag.
Updated October 8, 2026: Liquidation figures now reflect CoinGlass data as of 20:19 UTC, and ETF flows reflect CoinGlass data for October 7. A statement on US government wallet transfers and two analyst quotes were removed because they could not be verified. The earlier statement that IBIT was still attracting inflows was corrected: it recorded the largest outflow that day. Added a chart of the 24-hour change on Thursday evening and a FAQ section.





Be the first to comment