




TLDR
- Dogecoin trades near $0.086 after dropping below key support at $0.092, its lowest level in over two weeks.
- CoinGlass data shows $55 million in spot outflows over four days and $16 million in long liquidations.
- Dogecoin ETFs have recorded no inflows in October, per SoSoValue.
- Santiment data shows some whales shed 100 million DOGE since Tuesday.
- Analysts watch $0.083 and $0.078 as next support levels, while resistance sits near $0.086 to $0.088.
Dogecoin (DOGE) fell below a key support level this week as selling pressure grew. The token traded at $0.086 at press time, down 1.82% in 24 hours.
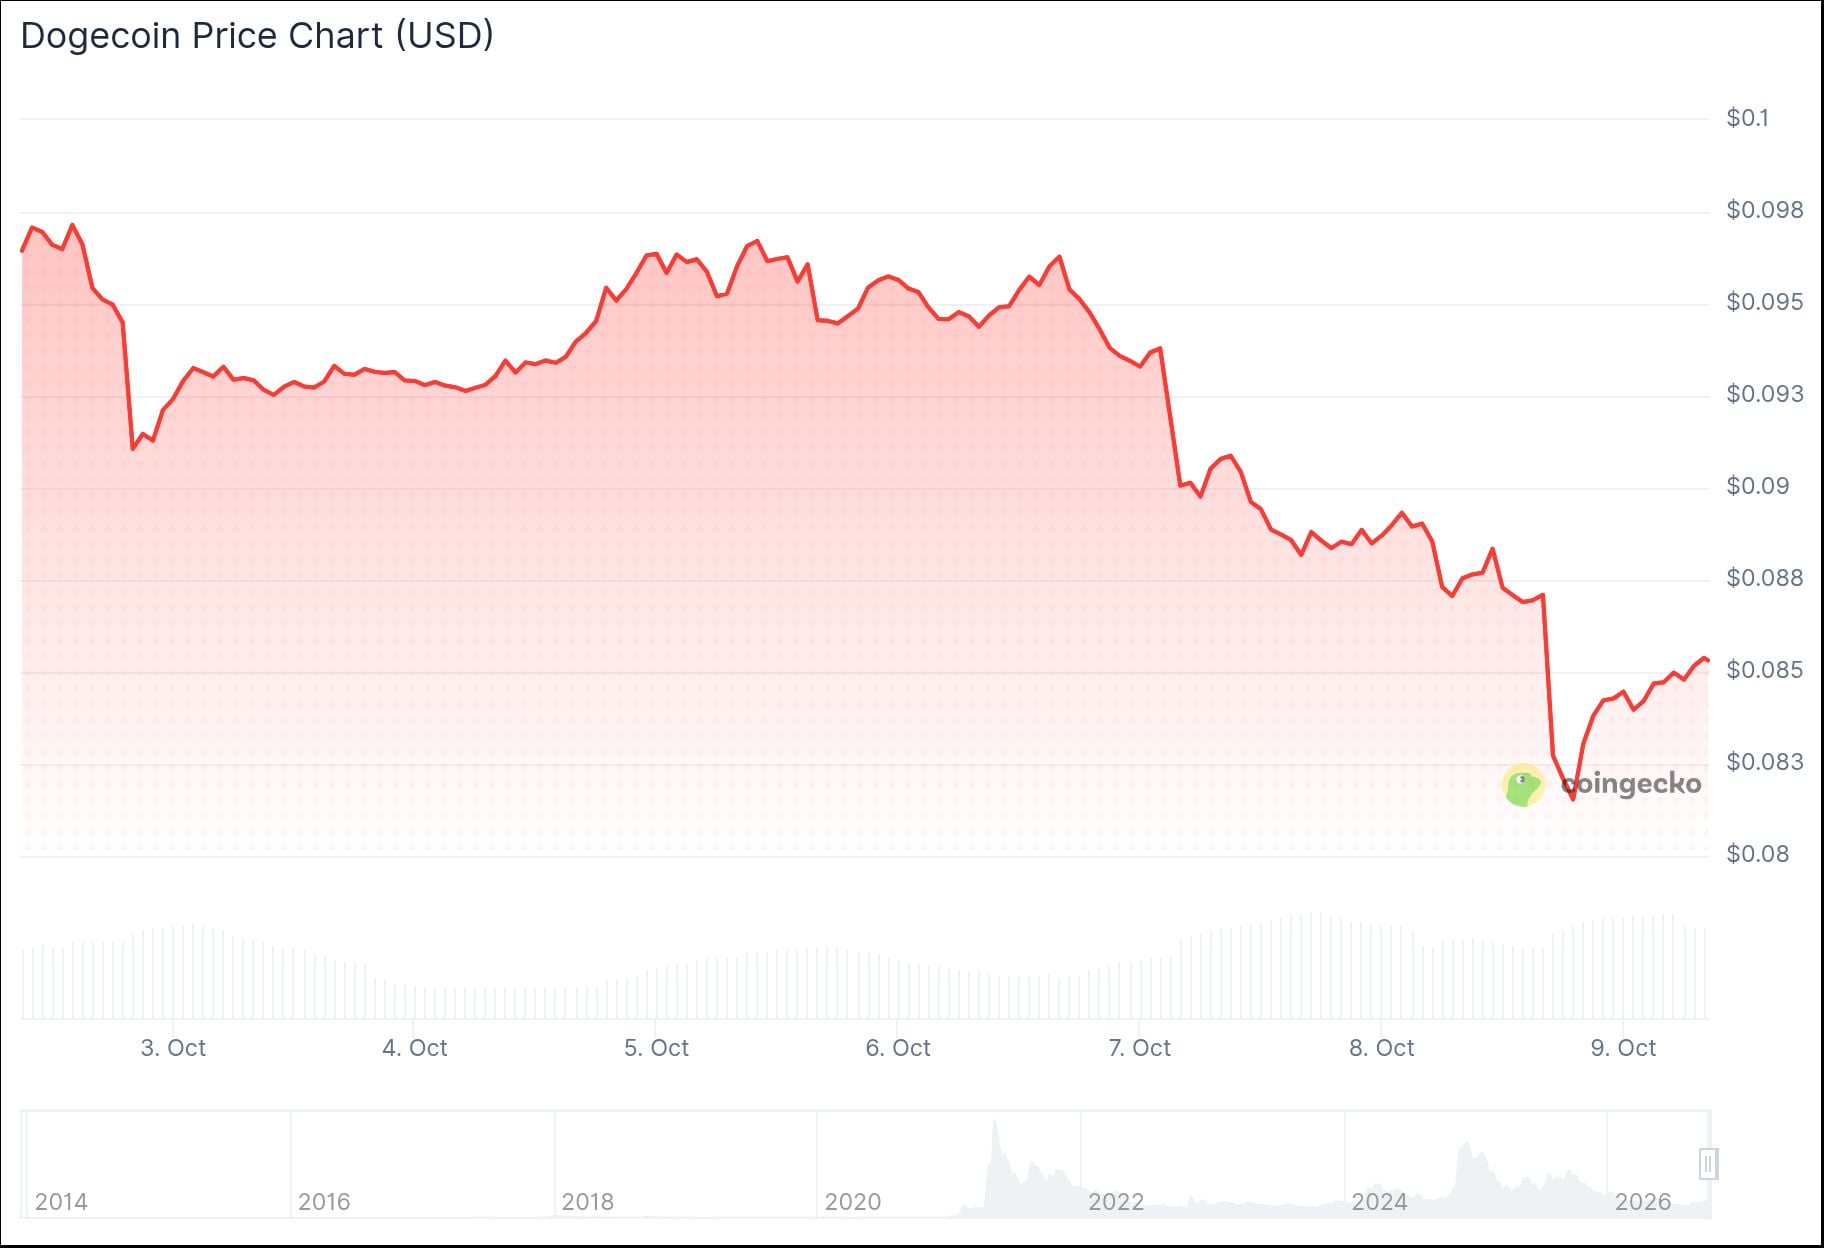
DOGE has lost more than 11% so far this week, according to FXStreet. It now sits at its lowest level in over two weeks.
Spot Outflows and Liquidations
CoinGlass data shows Dogecoin saw $55 million in spot outflows in the four days leading up to October 8. The numbers point to more selling than buying.
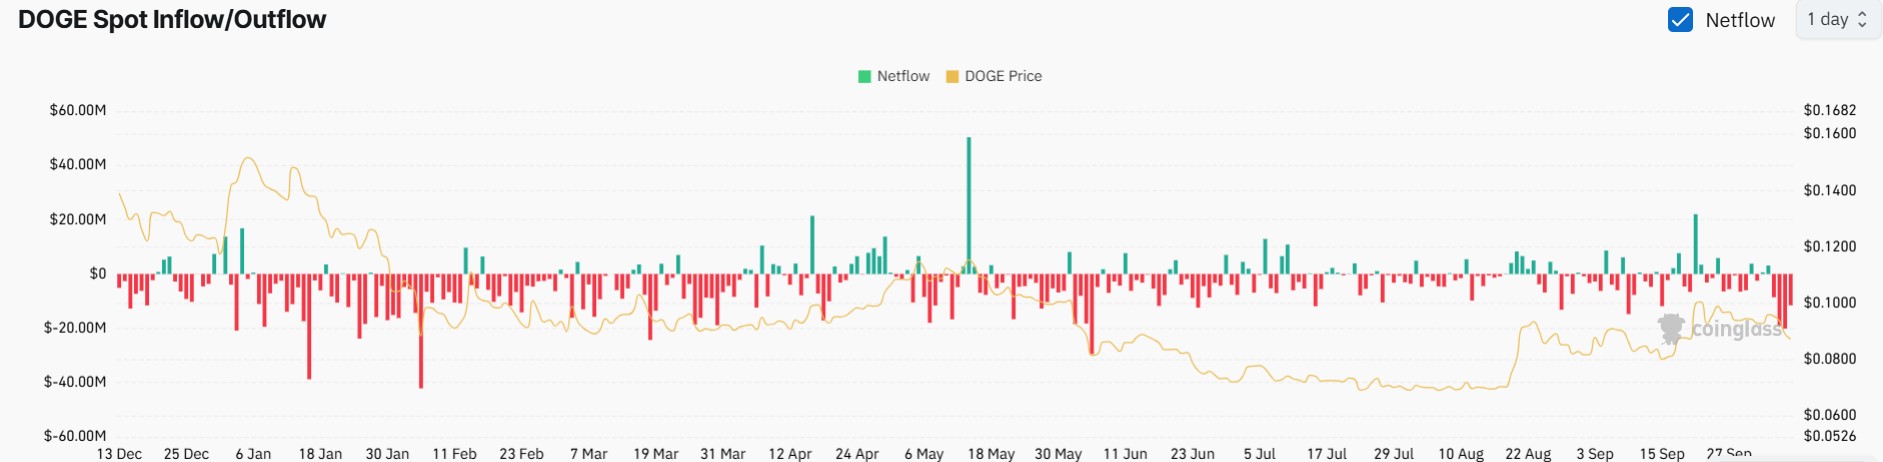
Market sentiment has weakened after Bitcoin fell below $84,000 following hawkish FOMC minutes.
Long liquidations added to the pressure. CoinGlass recorded $16 million in long liquidations over two days.
Demand from funds has also cooled. SoSoValue data shows Dogecoin ETFs have recorded zero inflows in October.
Open interest dropped from $1.53 billion to $1.38 billion, which suggests traders are cutting back on futures positions. DOGE’s long/short ratio fell to 0.89 as more traders opened short accounts.

The picture differs by exchange. Binance shows a long/short reading of 2.41, and OKX has four times more long accounts than short accounts.
Santiment data adds to the selling picture. Wallets holding between 1 million and 100 million DOGE have shed 100 million tokens since Tuesday, which may point to profit-taking.
Technical Levels to Watch
DOGE dropped below the 61.8% Fibonacci level at $0.092 on the daily chart. The next support is $0.083, and a break there could send the price toward $0.078.
The RSI reads 42, which is bearish but not yet oversold. That leaves room for further downside.
The ADX reading of 25 is tipping down, which suggests the downtrend is weak. FXStreet notes DOGE holds just above the broken trendline at $0.084. A daily close below it would expose $0.078 and $0.070.
Analyst LAR (@LAR7Crypto) posted on October 3 that accumulation in the triangle continues. He said the market maker is shaking out weak hands, and he has placed limit buy orders at $0.0892 and $0.0867, which he calls strong support areas. He targets $0.112.
$DOGE – Accumulation In The Triangle Continues🚨
Well, while the market maker decided to shake out the weak hands before a strong impulse to the upside, I continue building my entry!
I’ve placed several limit buy orders in a strong area of interest and will wait for the move… https://t.co/jgeT1g8kPC pic.twitter.com/q386y06KCP
— LAR (@LAR7Crypto) October 3, 2026
On the upside, bulls must clear the 100-day EMA at $0.086 and the 50-day EMA at $0.088. The 200-day EMA at $0.093 and resistance at $0.102 sit higher.
Some derivatives data leans positive. CoinGlass shows a long-to-short ratio of 1.18, and funding rates are at 0.0010%.
At press time, Dogecoin trades near $0.085 to $0.086, just above the $0.084 trendline support.



Be the first to comment