


What to know:
- Internet Computer sees rising on-chain activity as quarterly fees surpass $645K, signaling growing network adoption.
- The ICP price remains under pressure below $2.25 as the bearish trend continues across key moving averages.
- MACD hints early recovery for Internet Computer as bearish momentum slows, though confirmation is still pending

The Internet Computer network surpassed $645,000 in quarterly fees, reflecting rising on-chain activity and increasing demand for decentralized computation.
This milestone signals growing developer engagement and usage of smart contract-based services, highlighting a gradual shift from experimental infrastructure toward more consistent real-world utility within the ecosystem.
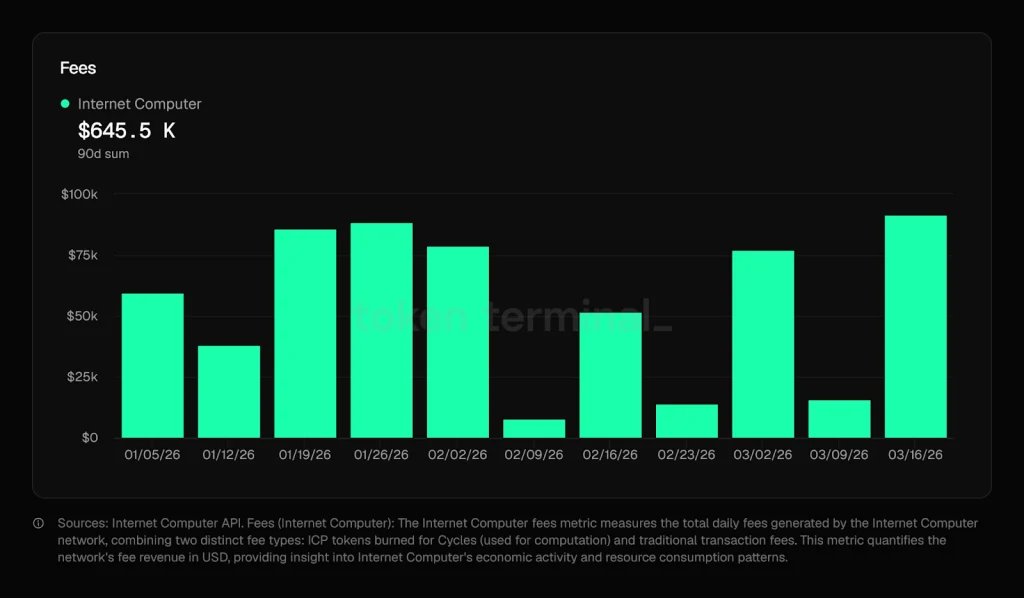
Source: Internet Computer Today’s X Post

Following the completion of Mission 70, which reduced inflationary pressures across the ICP ecosystem, momentum is expected to build further.
Combined with emerging interest in AI agents operating directly on-chain, analysts view the $645K figure as an early baseline. Future growth may accelerate as decentralized AI workloads and applications expand across the network.
Also Read: Internet Computer (ICP) Price at Risk: $2.30 Support Could Decide Next Move
ICP Price Faces Pressure Below Key Moving Averages
Despite this strong on-chain achievement, ICP has been in a continuous downtrend since mid-March. According to TradingView, the current price of ICP is $2.249, well below its respective 20-EMA, 50-EMA, 100-EMA, and 200-EMA.
The downtrend means that the bears are firmly in control, and even small dips are being rejected around the red 20-EMA line near $2.25.
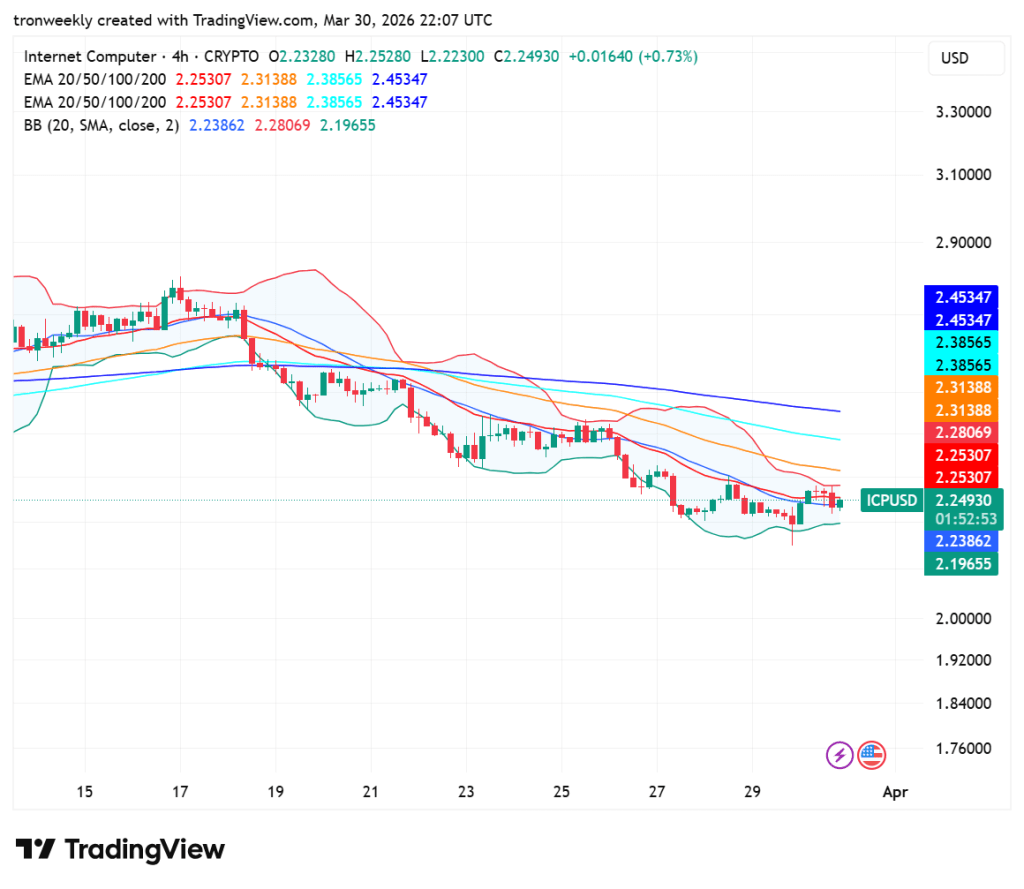
Source: TradingView
Technical indicators point to the price moving closer to its Bollinger Band’s midpoint at $2.23. Though volatility levels have eased in recent times, there is still a significant difference that places the asset at a considerable distance from the 200-EMA at $2.45. Until then, the trend will remain neutral or bearish, with support at $2.19.
Momentum Indicators Show Bearish to Neutral Outlook
The RSI is at 47.02, hovering just below the neutral mark of 50. This indicates that the intense selling pressure has eased somewhat, but the bulls are still not in full control.
The RSI line remains above its signal average of 41.58, which indicates the gradual climb out of the oversold zone.
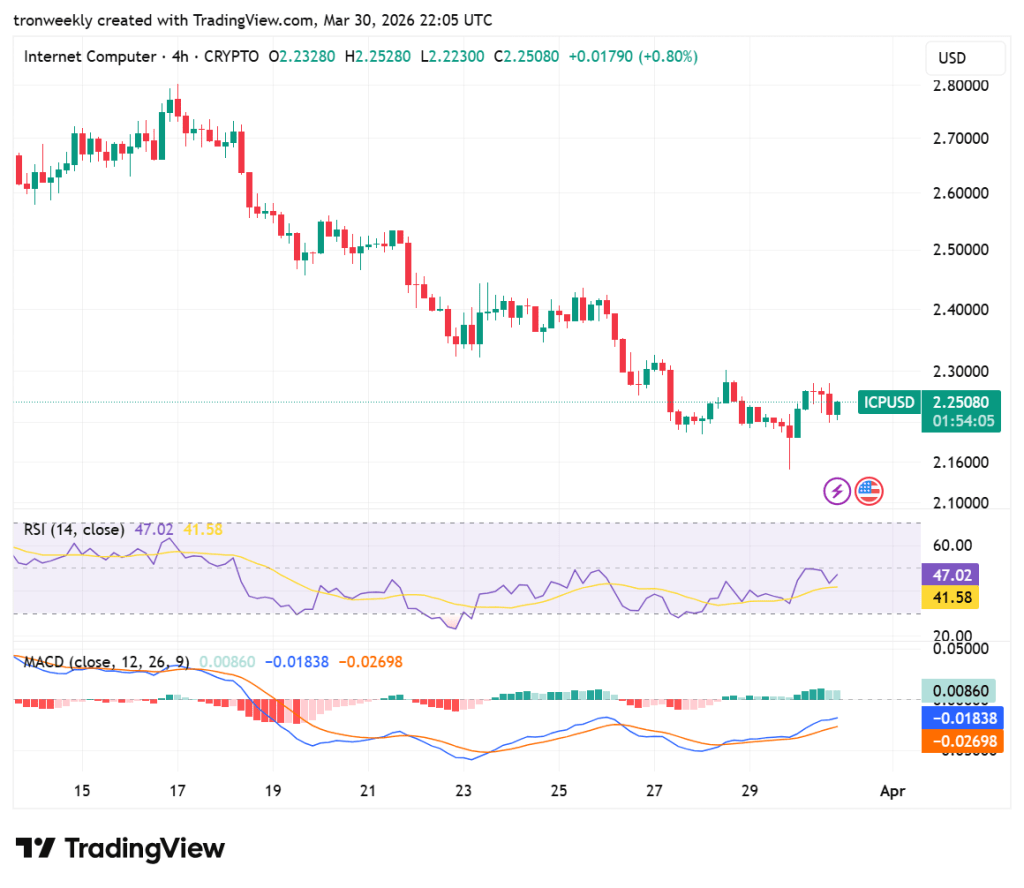
Source: TradingView
The MACD indicator shows a bullish signal with a bullish crossover, where the blue line is above the orange line. Although both lines remain in negative territory, the histogram is in green, indicating that the downward momentum is slowing down. However, since it is still in negative territory, there are sellers in the market until a strong breakout occurs.
This article contains market analysis and price predictions. These are not guarantees. Crypto markets are volatile. Always DYOR. Not financial advice.
Also Read: Internet Computer (ICP) Eyes Breakout to $17 as Buyers Defend Key Support

Be the first to comment