



Across the digital asset ecosystem, technical analysis is commonly—and mistakenly—treated as an infallible predictive tool. In reality, a price chart is a historical record compiling executed orders within a fragmented, 24/7 continuous market. When this data is interpreted with the requisite methodological rigor, traders can map out probable scenarios and neutralize emotional bias in decision-making.
Chart Anatomy: Scales, Timeframes, and Japanese Candlesticks

Every analytical reading begins by establishing the trading pair, the source exchange, and the appropriate visual scale. A logarithmic scale is essential across higher timeframes, as it weights identical percentage changes equally, eliminating the visual distortion of linear scaling. Across daily or weekly timeframes, structural moves remain insulated from short-term transactional noise.
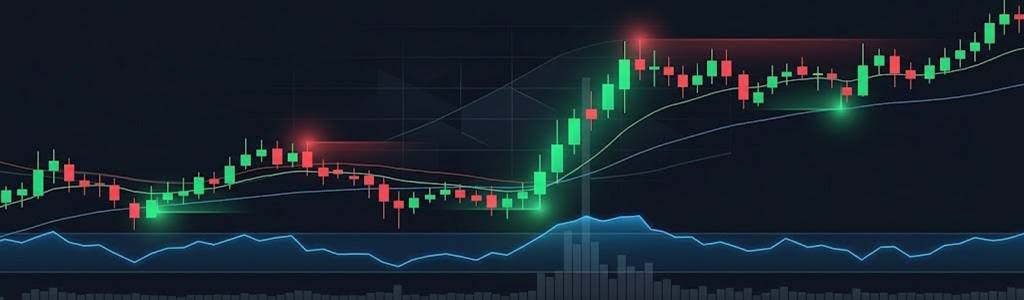
Each Japanese candlestick condenses four data points within its interval: open, high, low, and close (OHLC). The length of the body reflects directional conviction between the session’s open and close. Meanwhile, wicks (or shadows) reveal the extreme price ranges tested by buyers and sellers before printing the final price of the period.

Market Structure and Validation Through Trading Volume
Trend identification relies on the sequence of swing highs and swing lows mapped out by price action. An uptrend requires the sustained formation of higher highs and higher lows, whereas the inverse sequence confirms a bearish bias. Identifying these operational zones demands framing dynamic support and resistance areas rather than anchoring to exact penny levels.
Trading volume delivers the participation metric required to gauge the validity of any structural breakout. Across high-liquidity sessions, a price advance backed by expanding volume typically signals institutional absorption. Conversely, breakouts accompanied by drying volume leave the asset vulnerable to potential fakeouts and range traps.
Technical Indicators and Structural Invalidation Criteria
Oscillators such as the Relative Strength Index (RSI) or Exponential Moving Averages (EMAs) merely synthesize data already present in the price series. An overbought reading on an oscillator does not forecast an immediate reversal; it describes the velocity of the move relative to prior periods. Stacking multiple redundant formulas across the screen creates cognitive overload and degrades analytical clarity.
A rigorous analytical framework requires predefining the exact price level that invalidates the working thesis. Establishing an objective, measurable invalidation condition separates disciplined analysis from subjective speculation in digital assets. Chart patterns only gain statistical relevance when their confirmation zones are clearly delineated before entering the market.
Reading crypto charts is not about predicting absolute tops or bottoms—it is about managing probabilities with operational discipline. Every technical signal must be weighed against order book depth and macroeconomic fundamentals. Risk management and capital preservation must always take precedence over any pattern drawn on the screen.



Be the first to comment