



Arbitrum price expanding real-world asset (RWA) market is strengthening its position in tokenized finance, but weakening technical momentum could delay an ARB price recovery.
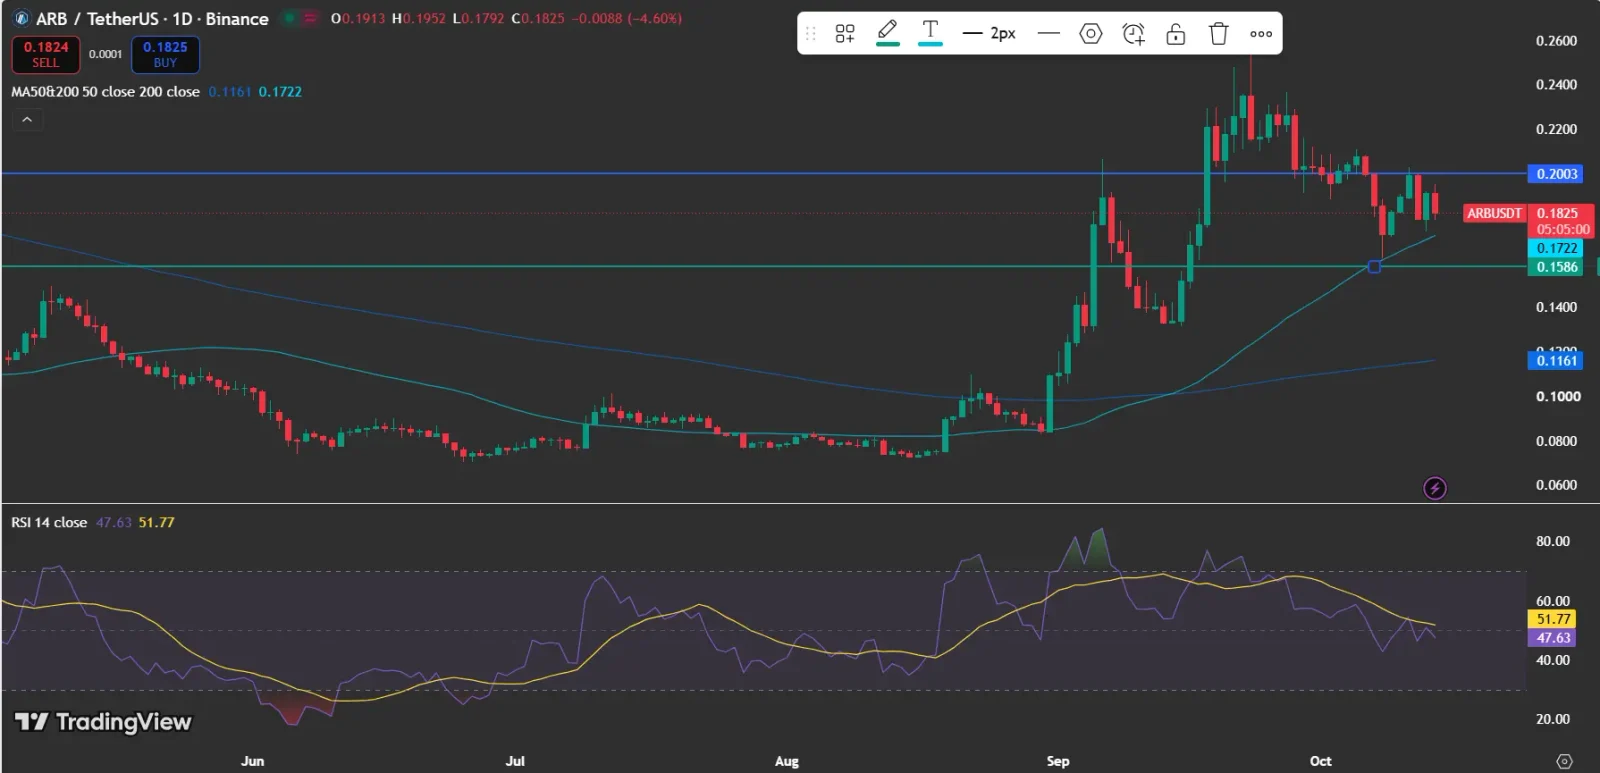
At press time, Arbitrum price is trading at $0.1825 at press time, down 4.60% over the past 24 hours. With the token below $0.2003 resistance, traders are watching whether support at $0.1722 can prevent further losses.
Also Read: Arbitrum Adds $127M in Stablecoins as ARB Price Eyes $0.23 Breakout
Why Is Arbitrum Price Under Pressure Despite RWA Growth?
Arbitrum’s official X account reported more than $1.2 billion in tokenized assets on Arbitrum One. Funds account for $922 million, followed by $191 million in stocks and $84.3 million in commodities.

The project stated that “the work is just getting started,” highlighting the potential to bring more traditional assets into the programmable economy. This provides a positive adoption signal, although growing RWA activity does not automatically create demand for ARB tokens.
Also Read: Arbitrum Expands Tokenized Energy Assets as ARB Tests Key Recovery Levels
What Does the Arbitrum Price Chart Reveal?
The daily TradingView chart shows ARB retreating after climbing above $0.23 in September. The token remains below $0.2003 resistance, indicating that buyers have yet to reclaim this level.
The Relative Strength Index (RSI) stands at 47.63, below its average of 51.77. This signals weakening momentum rather than oversold conditions. A sustained move above 50 could indicate improving buying pressure, but would not confirm a recovery on its own.
ARB remains above its 50-day moving average at $0.1161 and its 200-day moving average at $0.1722. The latter is an important support level to watch because a breakdown could weaken the current recovery structure.
Also Read: Arbitrum Price Eyes a Rebound Following the Drop to $0.1827
Can Arbitrum Price Recover Above $0.2003?
A breakout above $0.2003 would provide an initial bullish signal. If buying volume increases, ARB could target the $0.22–$0.23 range, where it traded during September.
On the downside, $0.1722 remains the key support level. A sustained break below it could expose the next identified support near $0.1586, increasing the risk of a deeper correction.
How Does Arbitrum Open Interest Affect ARB?
CoinGlass data shows open interest rising sharply during September, exceeding $300 million before declining. Despite retreating from its peak, open interest remains substantially higher than in early August.
Meanwhile, trading volume has declined from its September highs, suggesting that market activity has cooled. Elevated open interest can amplify price movements when traders adjust leveraged positions, but it does not establish whether bullish or bearish positions dominate.
Will RWA Adoption Support an Arbitrum Price Recovery?
Arbitrum’s $1.2 billion in tokenized assets offers a positive adoption signal, but ARB still needs stronger technical confirmation. A move above $0.2003, supported by rising volume and an improving RSI, would strengthen the recovery case.
If ARB falls below $0.1722, traders could watch $0.1586 as the next support. The relationship between network adoption and token demand remains important as traders assess the potential for a rebound.
Cryptocurrency markets remain highly volatile, and traders should monitor price action, market sentiment, and upcoming catalysts before making investment decisions.
Also Read: Arbitrum Adds Programmable Markets Through 1 New Protocol
This article contains market analysis and price predictions. These are not guarantees. Crypto markets are volatile. Always DYOR. Not financial advice.



Be the first to comment