




TLDR
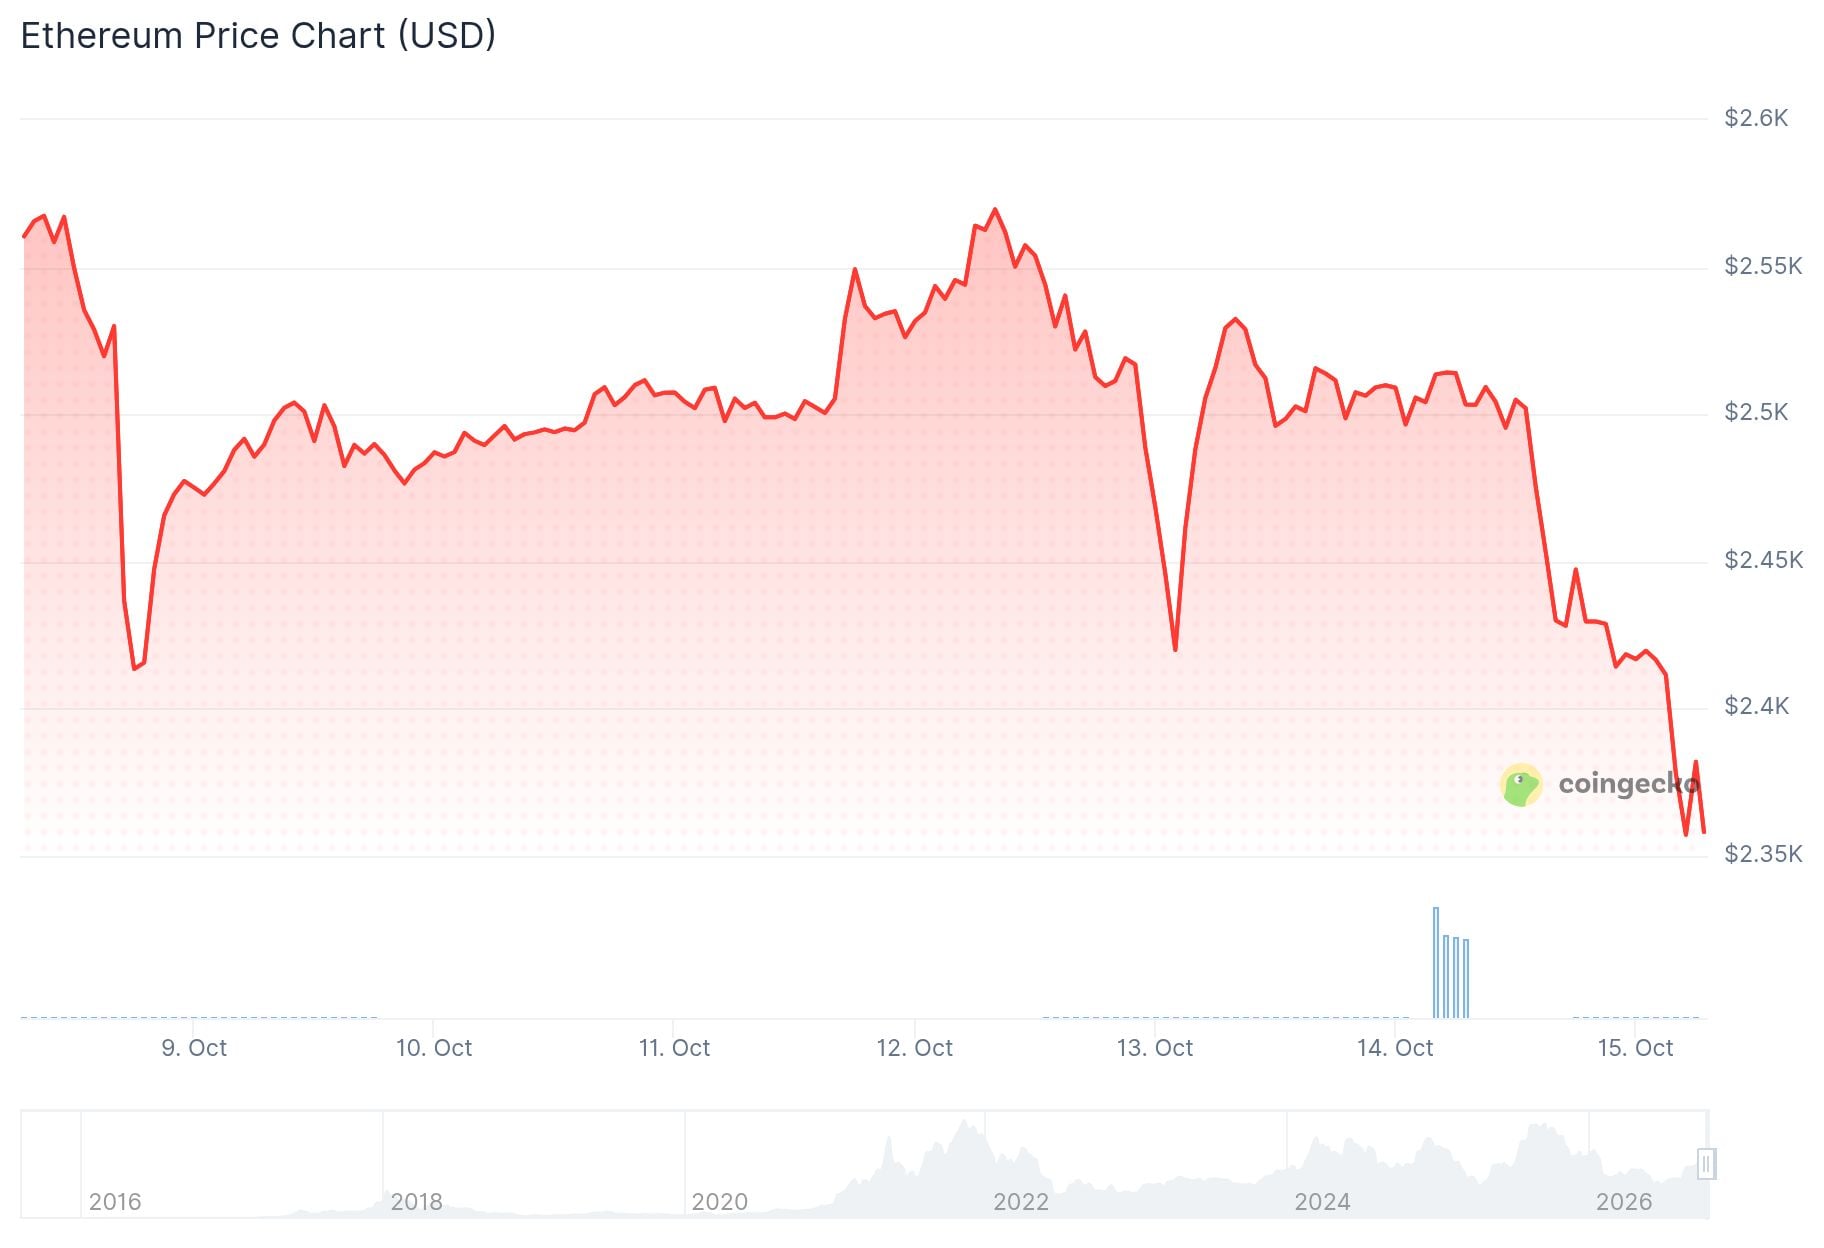
- Ethereum is trading near $2,361 on Oct. 15, down about 2.3% on the day after dropping as low as $2,316.74.
- ETH is testing a rising trendline from the June lows, with the next support zone at $1,850-$1,950 if it breaks.
- Daily RSI sits at 34.36 and MACD is negative at -39.12, showing bearish momentum.
- U.S. spot ETH ETFs saw $19.7 million in net outflows on Oct. 14, and about $715 million has left since Oct. 1.
- Crypto liquidations hit $959.43 million in 24 hours, with $879.71 million from longs.
Ethereum is trading around $2,361 on the Oct. 15 Binance daily chart. The price is down roughly 2.3% after a sharp selloff pushed it back toward a rising trend support line.
ETH opened near $2,419.80 and reached a high of $2,426.38. It then fell as low as $2,316.74 during the session.
This is one of Ethereum’s weakest sessions in recent weeks. For much of late September and early October, ETH held above the $2,500-$2,700 zone. It has now moved lower and is testing the $2,300-$2,400 area.
Chart Analysis
The blue trendline drawn from the summer low is now being tested directly. If that support holds, Ethereum may be able to stabilize and rebuild. If it breaks cleanly, the next downside area is the grey demand region between $1,850 and $1,950.
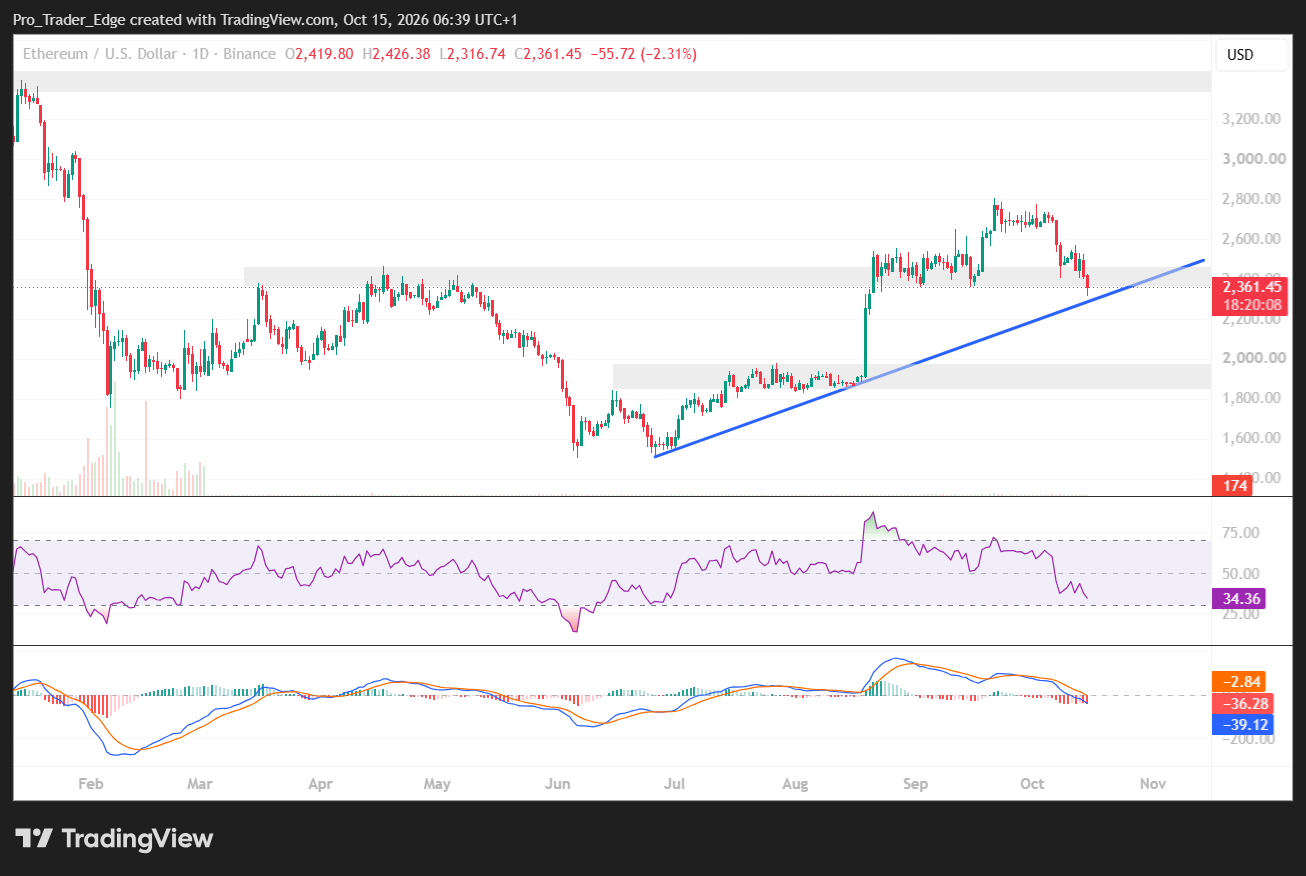
Momentum indicators have weakened. The daily RSI is 34.36, which is close to oversold territory. The MACD line is near -39.12, below the signal line at -36.28, and the histogram is negative.
On the upside, ETH first needs to reclaim $2,400-$2,450. Above that, resistance sits in the old support band around $2,500-$2,550. The level to watch next is the trend support near $2,300-$2,350, since a hold there could set up a move back toward $2,400.
ETF Flows Stay Negative
U.S. spot ETH ETFs recorded a net outflow of $19.7 million on Oct. 14. That followed a $24.8 million inflow on Oct. 13.

🇺🇸 ETF FLOWS: BTC and ETH spot ETFs saw net inflows on Oct. 13, while SOL spot ETFs saw net outflows. $BTC: $175.62M $ETH: $24.84M $SOL: – $1.04M pic.twitter.com/uXr4BZ4WCF
— CW (@CW8900) October 14, 2026
Before that one positive day, the funds saw steady outflows. They lost $85.4 million on Oct. 12, $56.1 million on Oct. 9, and $72.5 million on Oct. 8.
Since Oct. 1, the group has seen roughly $715 million in net outflows. This shows institutional demand has cooled during October.
The wider macro backdrop has also been difficult. Stronger inflation data and renewed talk of tighter U.S. monetary policy have weighed on risk assets. The U.S. dollar has stayed firm even after pulling back slightly from recent highs.
Long Liquidations Hit the Market
Total crypto liquidations reached $959.43 million over 24 hours. Of that, $879.71 million came from long positions and $79.72 million from shorts.
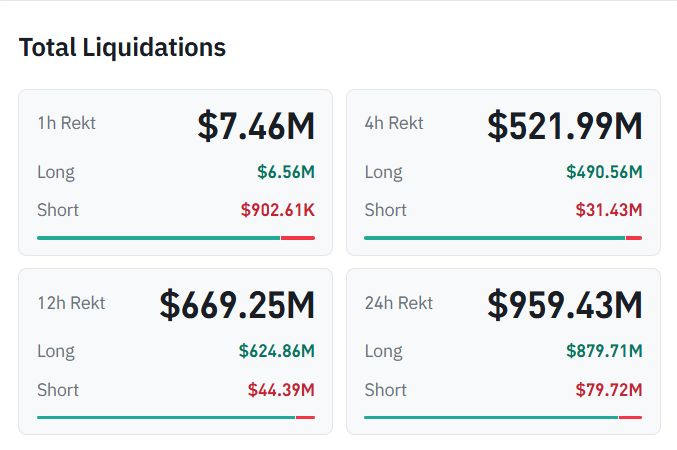
In the last 12 hours, liquidations totaled $669.25 million, including $624.86 million in longs. In the last 4 hours, $521.99 million was wiped out, with $490.56 million from longs.
Traders were leaning heavily to the bullish side. When ETH lost support levels, forced selling sped up the move lower.
Such events can lead to volatility in both directions. A sharp drop is sometimes followed by a relief bounce if selling pressure fades.
The key level for ETH is the trend support near $2,300-$2,350. If it holds, a move back to $2,400 and then $2,500 is possible. If it fails, the $1,850-$1,950 zone is next.


Be the first to comment