



Ether trades at $2,380.17, which is 5.41 percent below the level of 24 hours ago. The low of the day was $2,332.43, the high $2,524.82. The 2,400 mark the price had been orienting itself around for days has therefore been broken on the downside. Converted, you pay 2,122.21 euros for one Ether.
What matters for placing this is not the single price but the breadth: if only Ether falls, the cause lies with the network itself. If almost everything falls, a common cause from outside is at work. That is exactly what this editorial team counted today, and the result is unambiguous.
Ether falls to $2,332: the day’s range comes to 7.62 percent
Between the high and the low of the day lie $192.39. Measured against the high, that is 7.62 percent of swing within a single day. If you hold Ether, that means two things. First, the price you saw last night was not the price at which you would have sold this morning. Second, a range of that size is enough to close leveraged positions that were built for quieter days.
The Ethereum price prediction places the current move in the longer run. Over seven days Ether is down 7.16 percent, over 14 days 11.66 percent, over 30 days 4.7 percent. Comparing the time frames shows that the slide of the past two weeks accounts for the larger part of the monthly loss. Over a year, Ether sits 41.71 percent below its level of mid-October 2025.

From the all-time high of $4,946.05, reached on August 24, 2025, 51.88 percent are missing. Ether’s market capitalisation stands at $290.7 billion, trading turnover of the past 24 hours at $17.54 billion.
17 of 20 top coins in the red: our own count of market breadth
cryptoticker.io compiled this analysis itself on October 15, 2026. It rests on the 25 largest cryptocurrencies by market capitalisation. Five of them are stablecoins, whose price is pegged to a currency and says nothing about market direction. The remaining 20 assets were therefore the ones examined.
- 17 of 20 trade lower than 24 hours ago.
- 10 of 20 lose at least 5 percent.
- 2 of 20 lose at least 10 percent.
- 3 of 20 are in the black, and none of them by more than 1.32 percent.
- 18 of 20 are also in the red over seven days.
- 12 of 20 sit at least 50 percent below their own all-time high.
The three in the black are Tron at 0.02 percent, Figure Heloc at 1.32 percent and LEO at 0.33 percent. Two of them are tied to an exchange or a lender and follow the broad market only sluggishly in any case. That does not amount to a counterweight.
The heaviest loss is Zcash at 12.15 percent, behind it Rain at 10.81 percent. Then come Near at 7.56 percent, Chainlink at 6.12 percent, Litecoin at 5.83 percent, Cardano at 5.56 percent, Ether at 5.41 percent, Bitcoin Cash at 5.31 percent, Dogecoin at 5.23 percent and Stellar at 5.09 percent. Ether sits in the middle of that row. The sell-off is therefore not an Ethereum event the market follows, but a market event in which Ether runs along.
Market capitalisation at $2.749 trillion: 5.69 percent less in a single day
The entire crypto market has fallen to $2.749 trillion and has given up 5.69 percent of its value within 24 hours. That the total market loses more than Bitcoin is the clearest sign of the direction: capital leaves the smaller assets first.

Bitcoin dominance at 59.49 percent: Ether loses twice as much
Bitcoin trades at $81,501 and loses 2.7 percent; the low of the day was $80,444. The ratio is what counts here: at 5.41 percent, Ether loses exactly double what Bitcoin does.
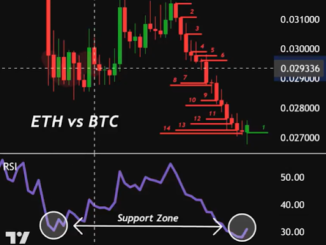
That ratio shows up in dominance, meaning the share of one coin in total market capitalisation. Bitcoin comes to 59.49 percent, Ether to 10.56 percent. The price ratio of Ether to Bitcoin stands at 0.0292. Anyone holding Ether in expectation of a catch-up move against Bitcoin is getting the opposite delivered this week.
Dominance is the share of one coin in the market capitalisation of all cryptocurrencies together. If Bitcoin dominance rises in a falling market, the remaining coins lose faster than Bitcoin. That is precisely what is happening today.
The level at $2,332: what the day’s low can be measured against
The low of the day at $2,332.43 is the most concrete number you have today, and not a forecast but the point at which enough demand last came together to turn the price. If the price stays above it, that demand has held. If it falls below, the demand is used up, and the next footing is open.
On the upside the situation is just as simple to describe. The 2,400 mark that broke today is now resistance from below: everyone who bought above that price and wants out without a loss is waiting there. Above it lies the high of the day at $2,524.82.
What the market does tomorrow, these numbers do not say. They do give you two values on which you can anchor your own decision instead of reacting to a feeling. Anyone trading without such levels decides by daily mood in a falling market.
How much of the loss sits in DeFi usage?
On Ethereum, $49.67 billion are currently locked in financial applications, out of $89.0 billion across all blockchains together. Ethereum therefore carries a good 55 percent of all locked capital. These sums are counted in dollars and fall with the price without any user withdrawing a thing. Nothing about a loss of confidence in the blockchain itself can be derived from that figure.
Buying in Germany: what a MiCA authorisation covers and what it does not
When the market falls broadly, the way you buy matters more than the entry price. Since the EU regulation MiCA applies in full, providers addressing retail clients in Germany need authorisation as a crypto-asset service provider. Which exchanges hold that authorisation, what fees they charge and how they hold client balances is in the comparison of the best crypto exchanges.
What matters is what an authorisation does not deliver. The provider is bound to rules on own funds, custody, complaint procedures and supervision. It does not replace deposit protection: for crypto-assets there is no compensation like the 100,000 euros per client on bank deposits. A price loss is never covered in any case, by no provider and in no country.
Holding period and loss offsetting at a 41.71 percent annual loss
In Germany, gains from selling crypto-assets are tax-free after a holding period of one year. Within the year they count as a private disposal and are taxed at your personal rate, above an exemption threshold of 1,000 euros per calendar year.
At an annual loss of 41.71 percent, that calculation turns around. If you sell within the one-year period at a loss, that loss can be offset against gains from other private disposals in the same year, including those from other coins. If you sell after the period has expired, the sale is irrelevant for tax purposes, and the loss expires in tax terms just as a gain would have stayed tax-free.
That is not advice to sell. What follows from it is that the purchase date of each individual position determines your room for manoeuvre on tax, and that you have to know that date before you decide in a falling market. Which tools track holding periods position by position is shown in our comparison of crypto tax software.

Leverage and liquidation price: when the exchange closes the position itself
A daily range of 7.62 percent is uncomfortable for unleveraged holdings and otherwise without consequence. For leveraged positions it is the danger. The liquidation price is the price at which your collateral is used up and the exchange closes the position by force. At fivefold leverage it sits roughly 20 percent from the entry, at tenfold leverage around 10 percent, in each case before fees and funding costs.
Added to that is the funding rate, the ongoing payment between buyers and sellers of a perpetual futures contract. That payment keeps the contract price at the spot price. If it is positive, the buyers pay, and long positions held for a while cost money even when the price stands still. How funding, leverage limits and liquidation rules differ between venues is set out in the comparison of the best perp DEXs.
How much was actually force-closed today you can look up yourself on the liquidation overview from CoinGlass. The sums listed there come from the exchanges and are added during the day.
Staking and custody: locked Ether cannot be sold in a sell-off
Anyone staking Ether makes it available to the network as collateral and receives a reward for it. The price for that is availability: staked Ether cannot be sold immediately. The release runs through a queue whose length depends on the number of simultaneous exits. In a sell-off many want out at the same time, and that is precisely when the queue is longest.
With offers through an exchange, availability also hangs on the provider’s terms. Before your next entry, therefore check how long the release takes and whether the provider may suspend it in the event of a disruption. That clause is in the terms of use, not on the product page.
For custody, the same applies in a falling market as in a rising one: holdings you want to keep for longer belong in storage that only you can access. The devices and how they are operated are compared in our hardware wallet overview. Price moves change nothing about that; an insolvency of a provider does.
Market breadth: what the numbers do not yield
The count shows that the sell-off is broad. Why it is broad, it does not show. A cause cannot be established from price data alone, and any attribution to a single piece of news would be guesswork at this point. What stands out is the pattern alone: that 17 of 20 assets fall at the same time and the total market loses more than Bitcoin fits a withdrawal of capital from the asset class and not a problem at a single network. That is a reading, not a statement of fact.
The duration is equally open. That 12 of the 20 assets examined have lost at least half of their peak describes the state and says nothing about the next month. Anyone deriving a direction from that figure is adding an assumption the figure does not contain.
Ethereum below $2,400: 2,332 is now the measuring line
Three steps with which you clarify the situation for your own portfolio:
- Look up the purchase dates of each position. At an annual loss of 41.71 percent, the holding period decides whether a sale achieves anything on tax. Which tools track these periods position by position is set out in the comparison of crypto tax software.
- Recalculate the liquidation price of every leveraged position. A daily range of 7.62 percent is enough to close tenfold leveraged positions. The leverage limits and funding rules of the venues are compared in the overview of the best perp DEXs.
- Check your own provider’s authorisation and custody. A MiCA authorisation governs supervision and custody; it replaces no deposit protection. Which exchanges hold it is shown by the comparison of the best crypto exchanges.
The price figures in this article reflect the state of October 15, 2026. The running price and the daily range you will find on the Ethereum overview from CoinGecko.
(As of October 15, 2026. This article is not investment advice. Prices and fee structures change; check the terms with the provider before you buy.)




Be the first to comment