



Following the release of September’s CPI data, which came in hotter than expected at 3.7%, the wider crypto market took a beating.
Solana was no exception, with the altcoin falling by 5.10% in 24 hours to $102.19 at press time. With bearish momentum evident on both the daily and 4-hour charts, SOL may see further downside before any recovery.
Daily chart flashes signs of red
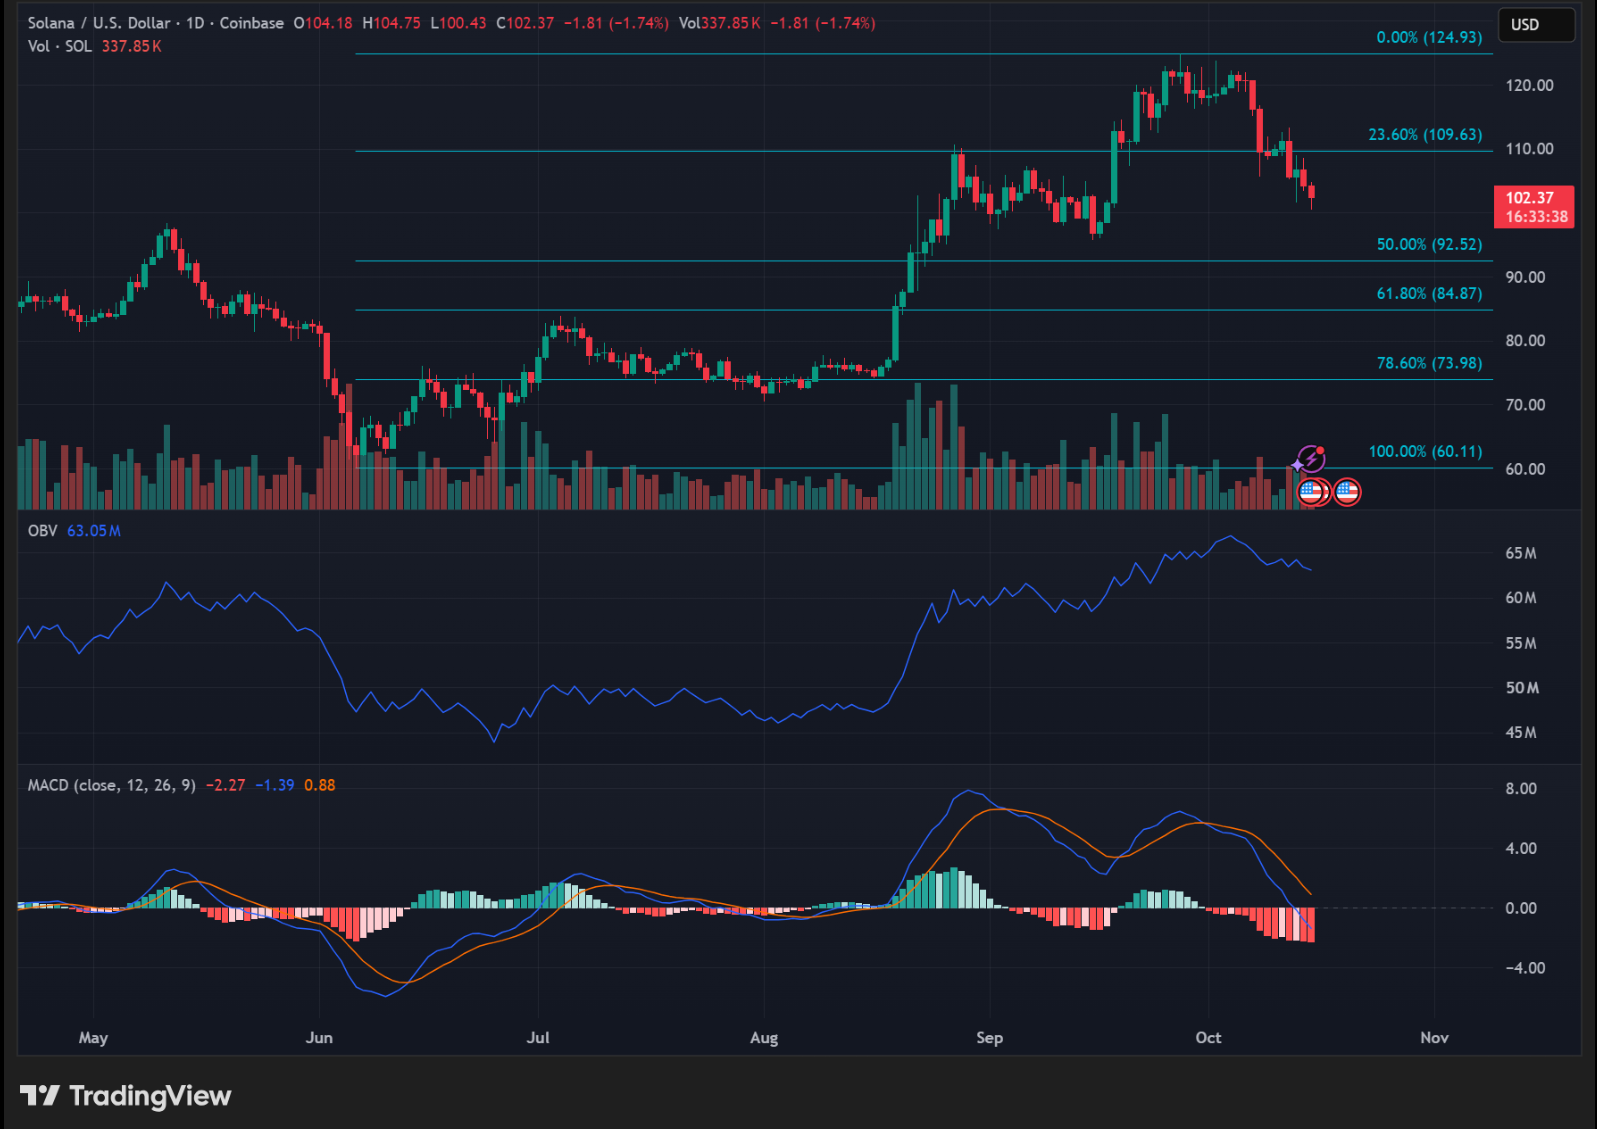
At the time of writing, the daily chart was still very much in bearish territory, with no signs of a reversal. SOL’s price broke below the 23.6% Fib retracement level, an area it has traded in since mid-September, with the altcoin in the key $100-$105 support zone. If buyers can’t hold that area, then a daily close below $100 would expose SOL to the next major support zone at $96.
Momentum indicators also supported the bearish outlook. The MACD was below both the zero and signal lines, indicating that bearish momentum was dominant.

Meanwhile, the OBV had turned lower, suggesting that buying pressure was weakening relative to selling activity. In fact, neither indicator seemed to suggest that the downtrend was losing strength.
SOL’s 4-hour chart offers little reassurance
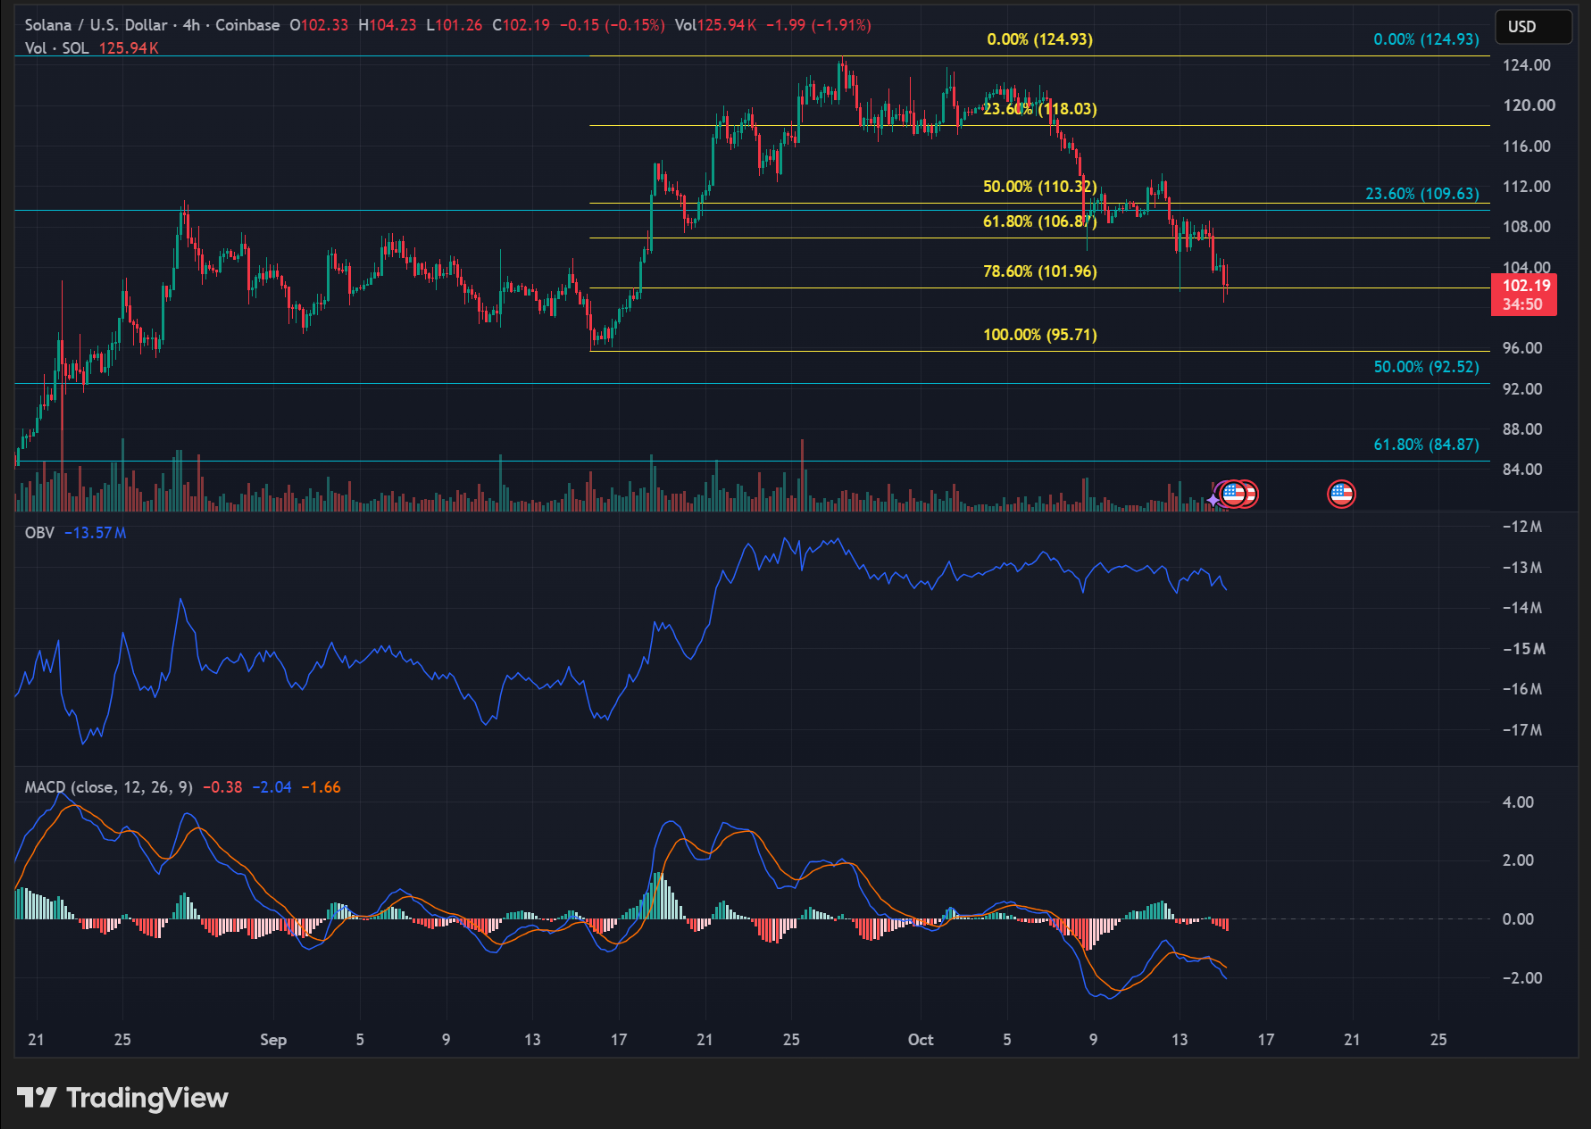
The 4-hour chart was bearish too, with SOL at the 78.6% Fib retracement (the ‘golden’ zone in this scenario). That area could see some buying activity as the market tries to hold the recent swing. However, the momentum indicators didn’t really point to a genuine recovery on the way.
While the OBV has fluctuated, it has stayed broadly sideways too, showing little change in buying and selling pressure. The MACD appeared to be below the zero and signal lines as well, reinforcing the bearish outlook.
Despite bearish signals on the four-hour chart, the daily chart showed SOL holding within the premium range around the 50% Fibonacci level. This might offer broader context for a potential recovery, despite short-term momentum being bearish.
Final Summary
- SOL’s bearish daily chart has the $100-$105 support area in serious jeopardy.
- 4-hour chart’s bearish momentum provided very little evidence of a sustained recovery off the 78.6% Fibonacci level.



Be the first to comment