



US price increases went from an annual rate of 3.4% in August, to 3.7% in September, dealing a blow to the U.S. stock market and pushing Bitcoin into a potential breakdown. With the S&P 500 facing a further fall at the open on Thursday given the dreadful PPI data, could this result in Bitcoin confirming its breakdown?
Make or break time for the Bitcoin rally
Source: TradingView

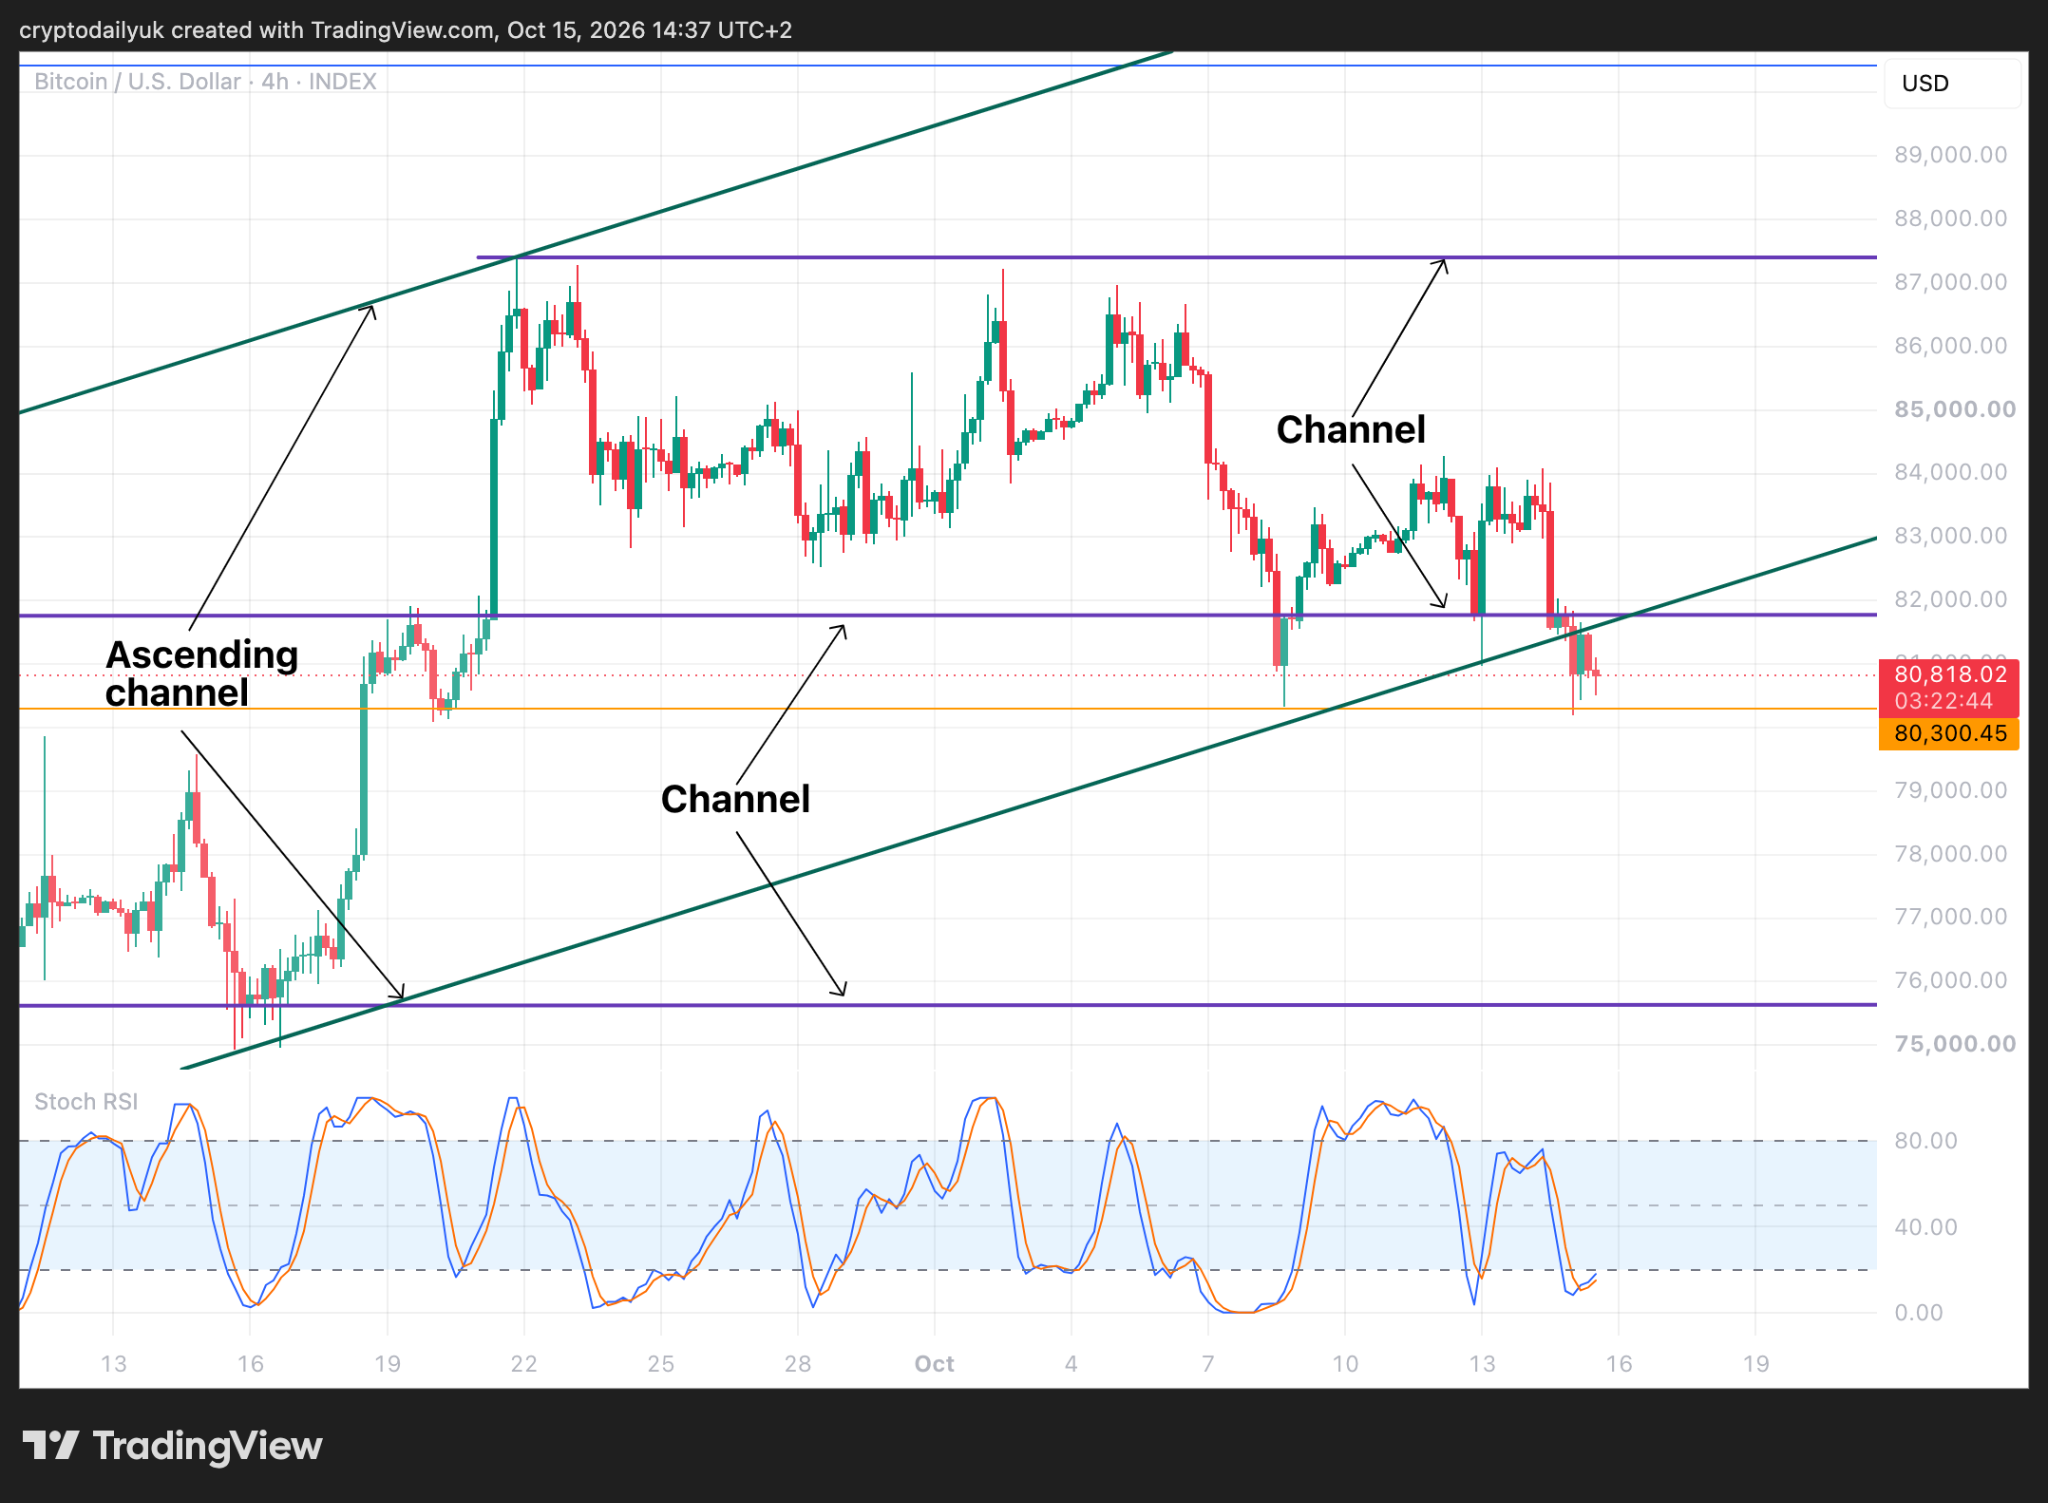
As can be seen in the 4-hour chart above, the $BTC price has broken below the bottom of the ascending channel. Three candle bodies have already closed below while a fourth one is deciding whether it might fall further, or add to a potential bear flag which is forming.
This is make or break time for a Bitcoin rally that climbed 39% from the bottom up to a high of around $87,400. However, since that local top, an unbroken series of lower highs and lower lows has led to the current crisis point, as the $BTC price dangles from the bottom of the ascending channel with what could be a big drop in front of it.
Confirmation of the breakdown next?
Source: TradingView
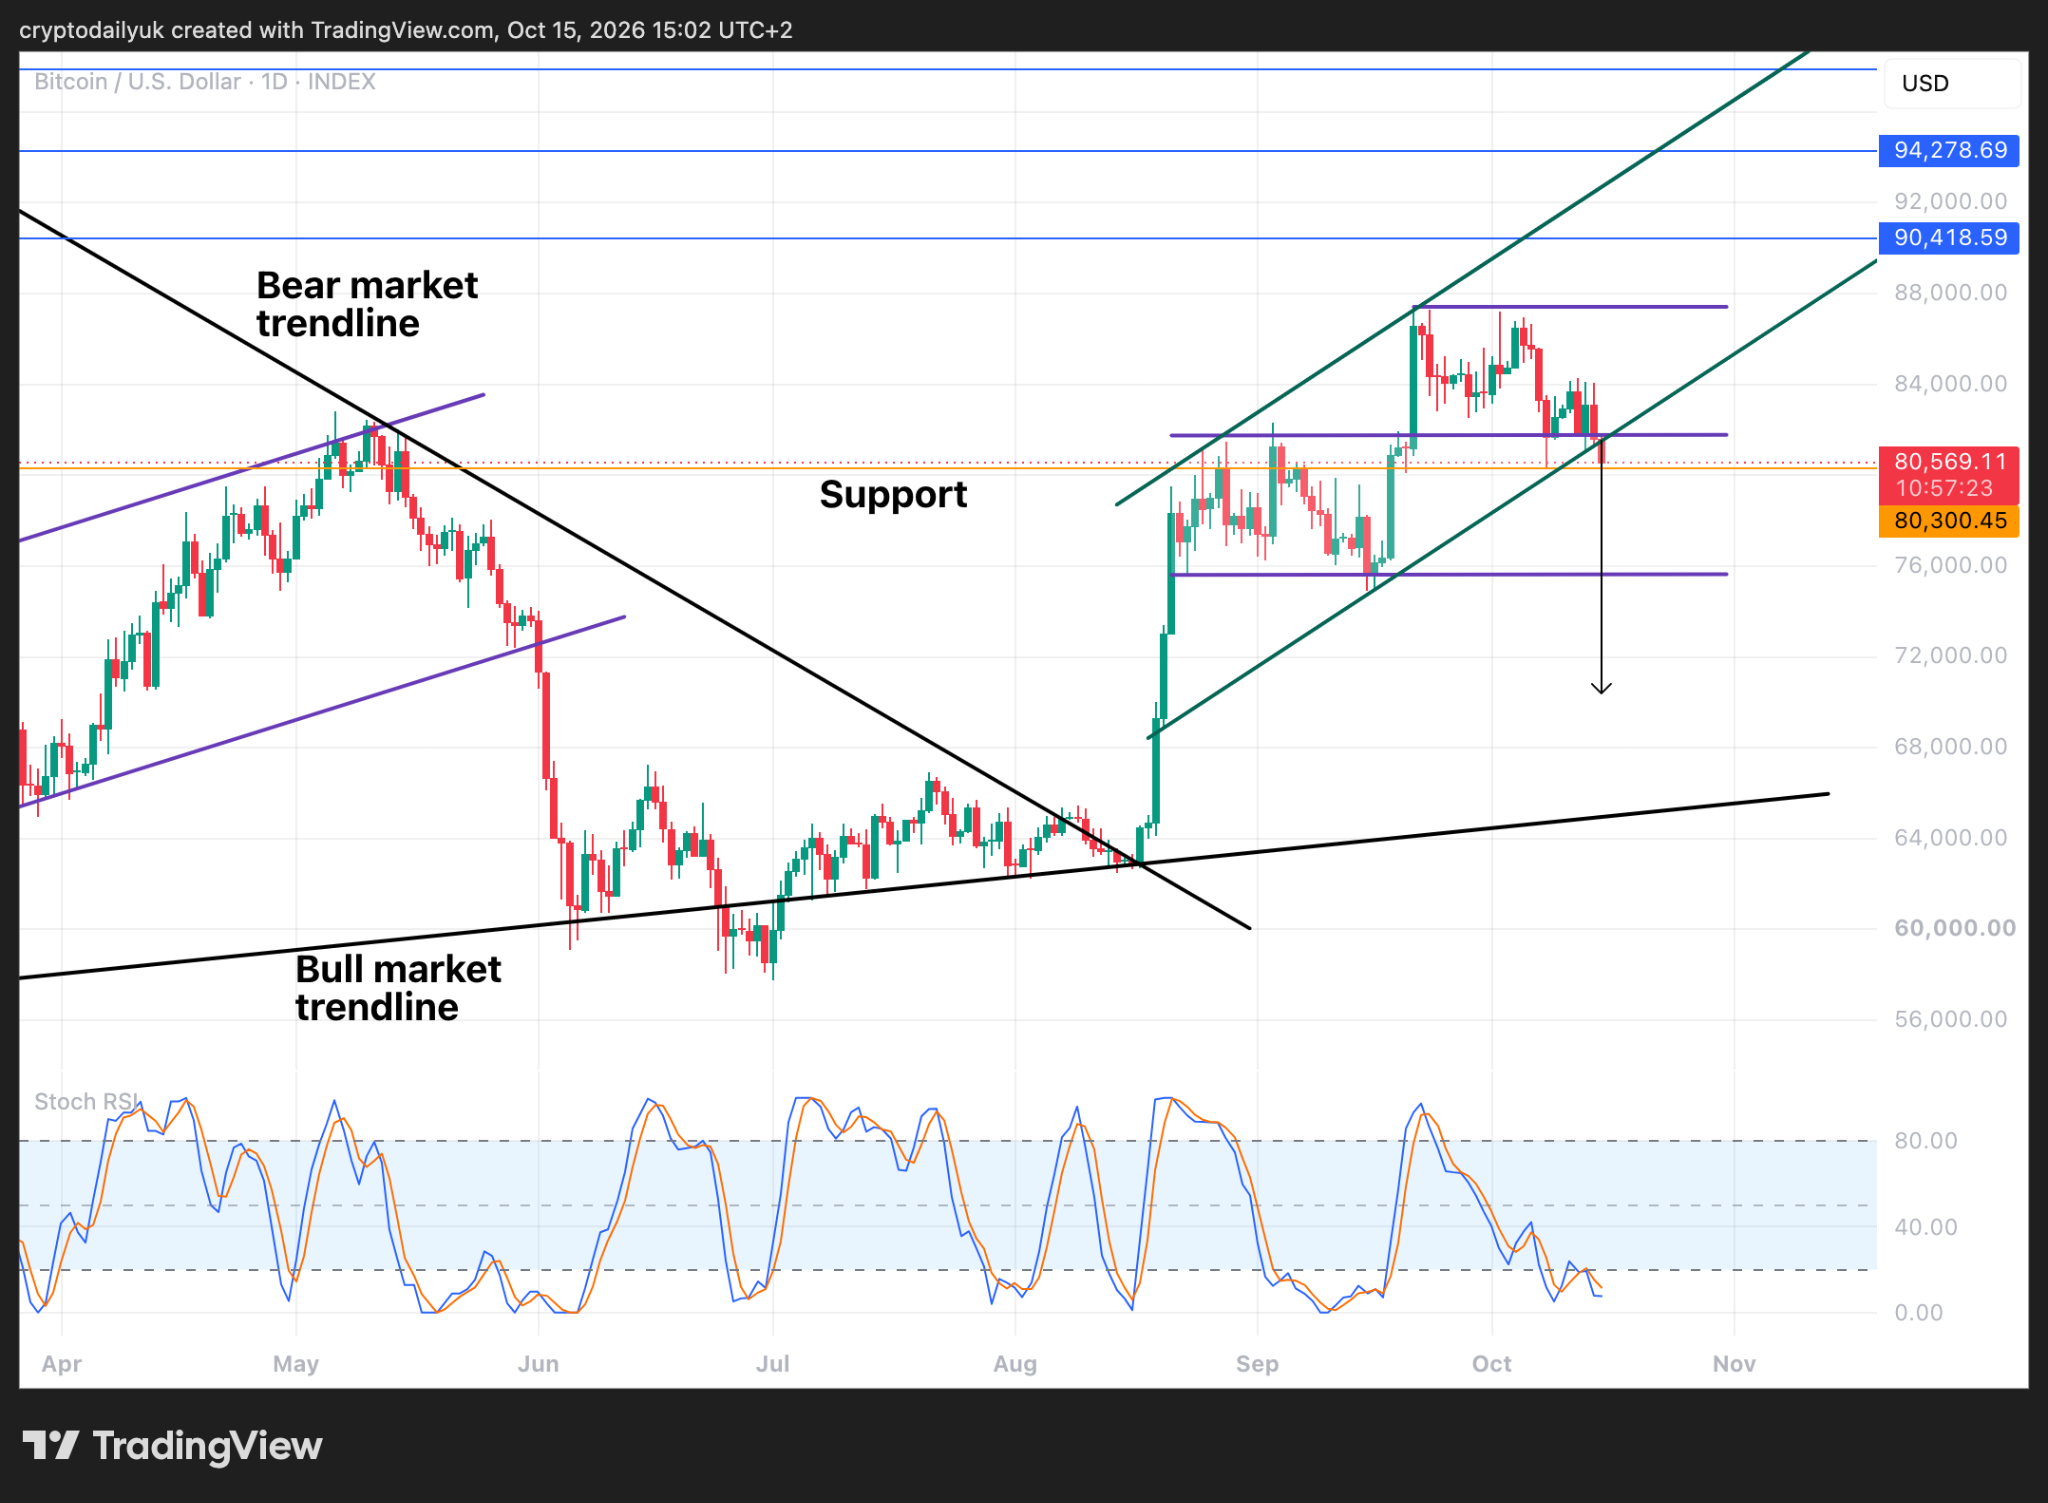
The daily time frame reveals the first candle that could close beneath the ascending channel if it does not climb back inside by the end of Thursday. The $BTC price is currently sitting on support at $80,300, while the full measured move out of the channel is shown by the arrow pointing to around $70K. From here, it might be expected that the price comes back up to test and confirm the bottom of the rising channel, and also the resistance at $81,770, before heading back down to perhaps the full extent of the measured move.
A fall to around $70K?
Source: TradingView
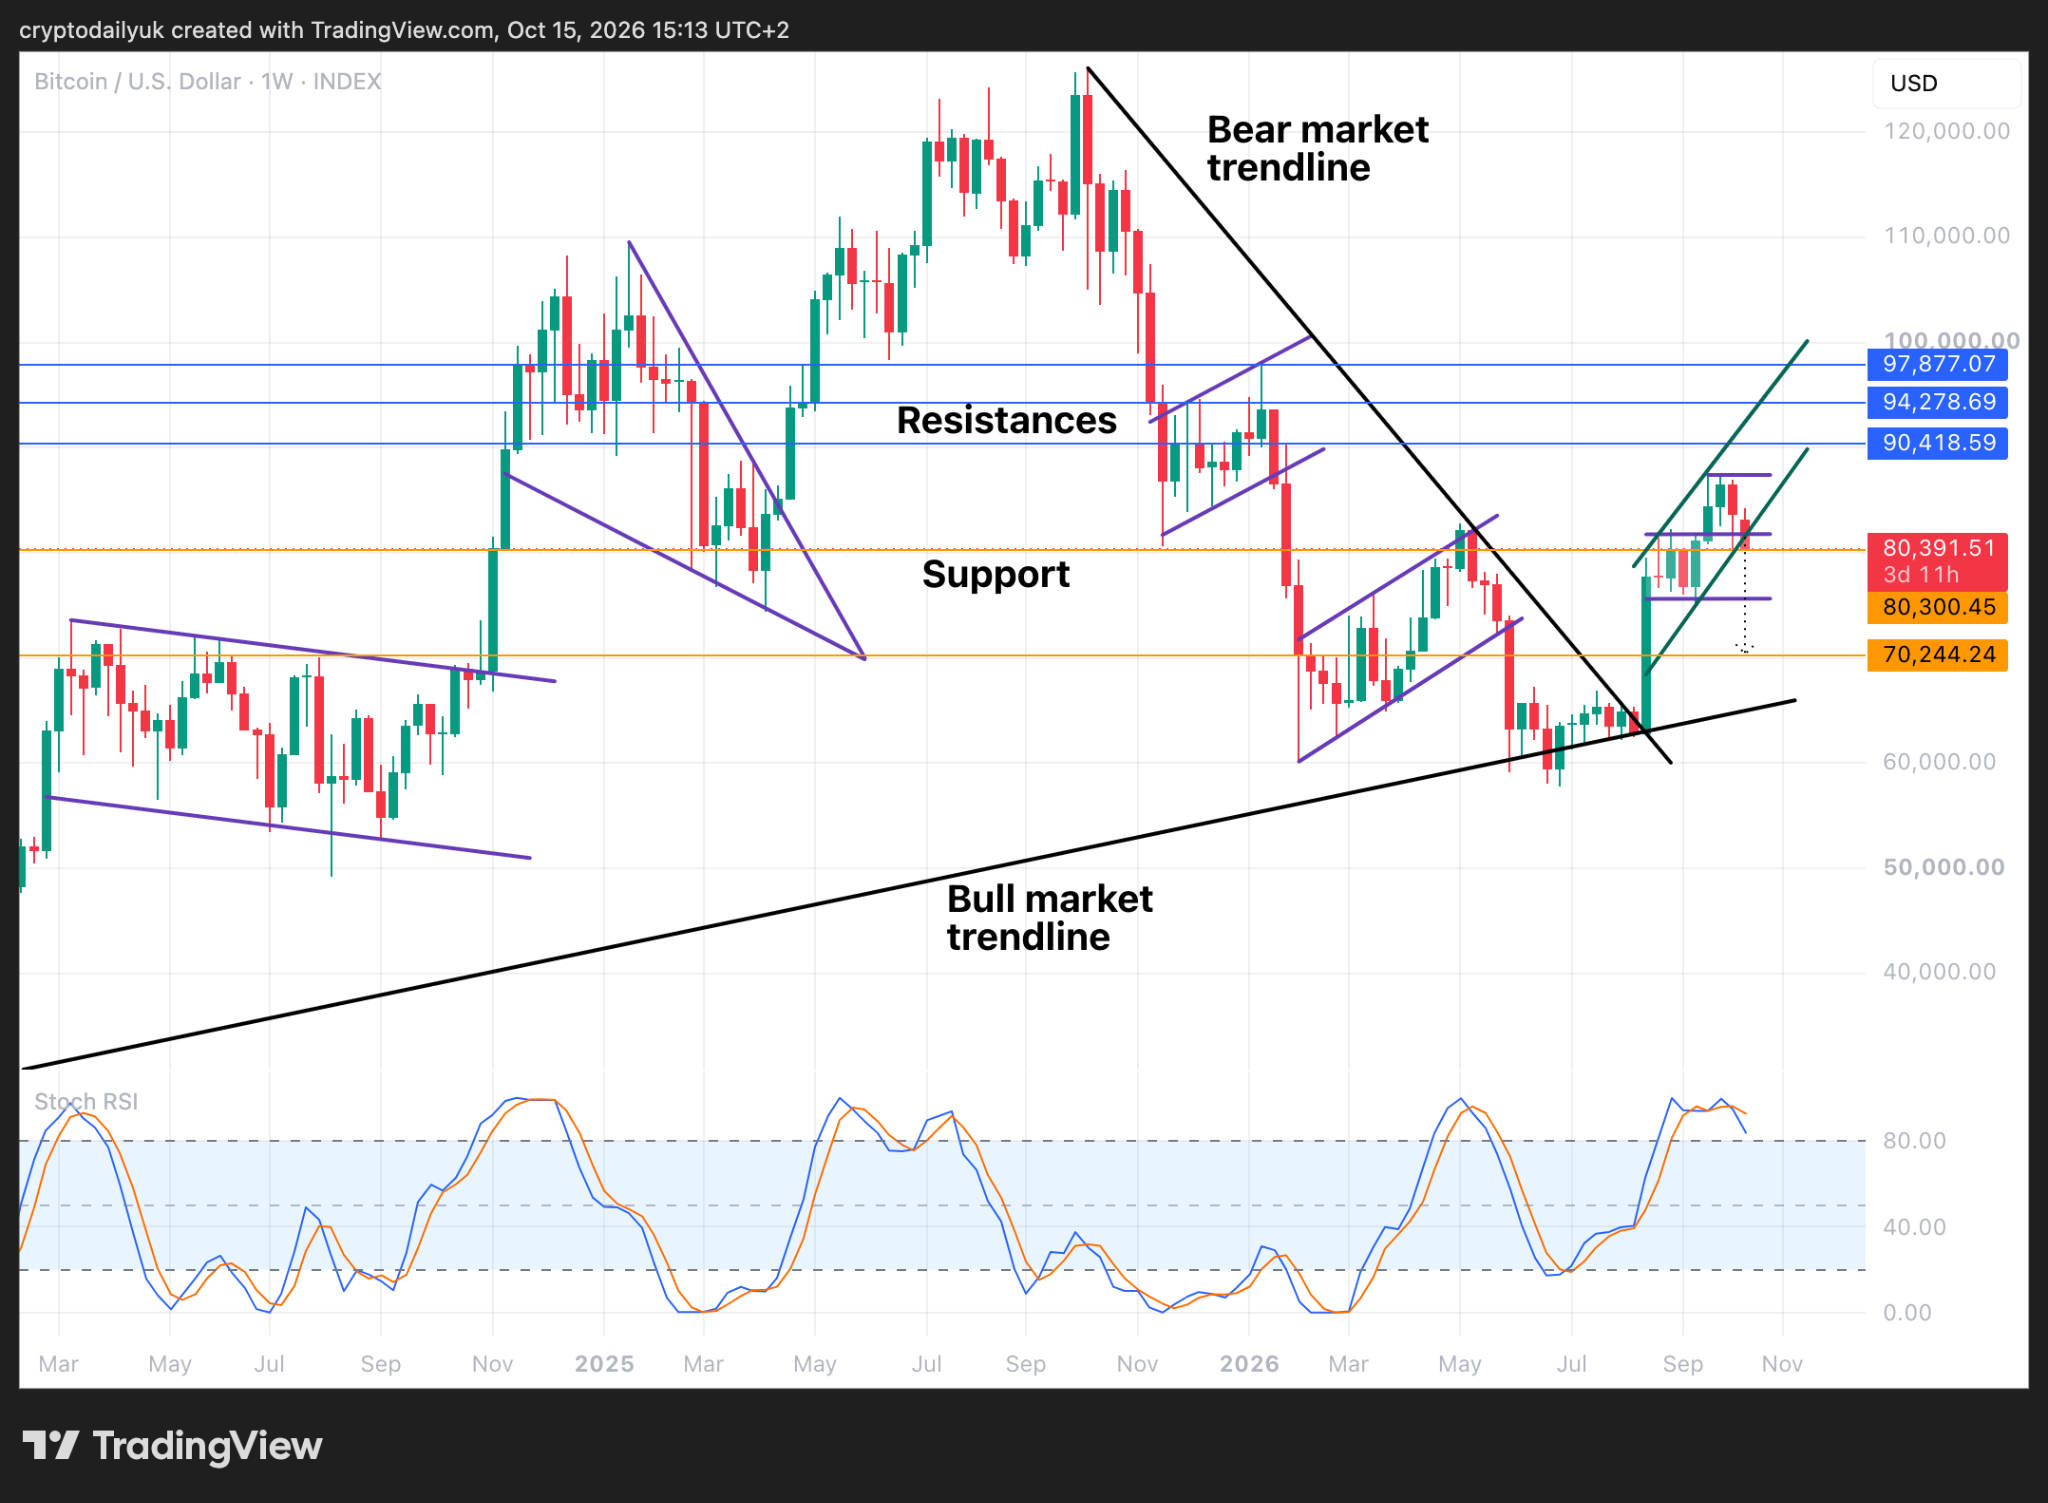
Here in the weekly time frame the current support level at $80,300 does look like a strong one. If it does fail, there isn’t too much support until the full measured move out of the ascending channel is reached, down at just over $70K. Could this be a sign that this is where the $BTC price is going?
The Stochastic RSI in the weekly might also be trying to tell us something. The cross-down of the indicator lines is looking a lot more pronounced now. If they come down and pass below the 80.00 level, this would be an excellent indicator that the big correction is starting. It just remains to be seen how far down it could go.
Disclaimer: This article is provided for informational purposes only. It is not offered or intended to be used as legal, tax, investment, financial, or other advice.






Be the first to comment