



Ethereum price is facing renewed scrutiny as a $92 million whale long position reportedly sits close to liquidation.
Ethereum has drawn fresh scrutiny in the derivatives market after a crypto whale used 14x leverage to open a $92.17 million ETH long, putting the trade reportedly close to liquidation. This position underscores the hazards of aggressive bullish wagers, especially as Ethereum’s recent price drop coincides with declining open interest.
According to crypto analyst Ted Pillows, the whale is reportedly just $64 away from full liquidation. The situation has spotlighted the dangers confronting leveraged traders and raised questions about whether current market conditions can sustain such a hefty bullish bet.
Also Read: Ethereum Price Eyes Powerful $2.7K Breakout After Fakeout

Why Is Ethereum Price Facing Liquidation Risk?
In a post on X, Ted Pillows reported that a whale had opened a $92,173,000 ETH long position using 14x leverage. The analyst added that the position stood only $64 from full liquidation.
Pillows wrote that the whale had opened a “$92,173,000 $ETH long with 14x leverage” and was “$64 away from getting fully liquidated.”
This trade illustrates the dangers that come with employing heavy leverage. Although leverage lets traders control bigger positions with less upfront capital, even a relatively small adverse price movement can trigger liquidation once the margin backing a position becomes insufficient.
For Ethereum traders, the whale’s position serves as a reminder that sizable bullish bets do not automatically signal How the trade ends up depends on ETH’s price action and the margin available to support the position.
What Does TradingView Reveal About Ethereum Price?
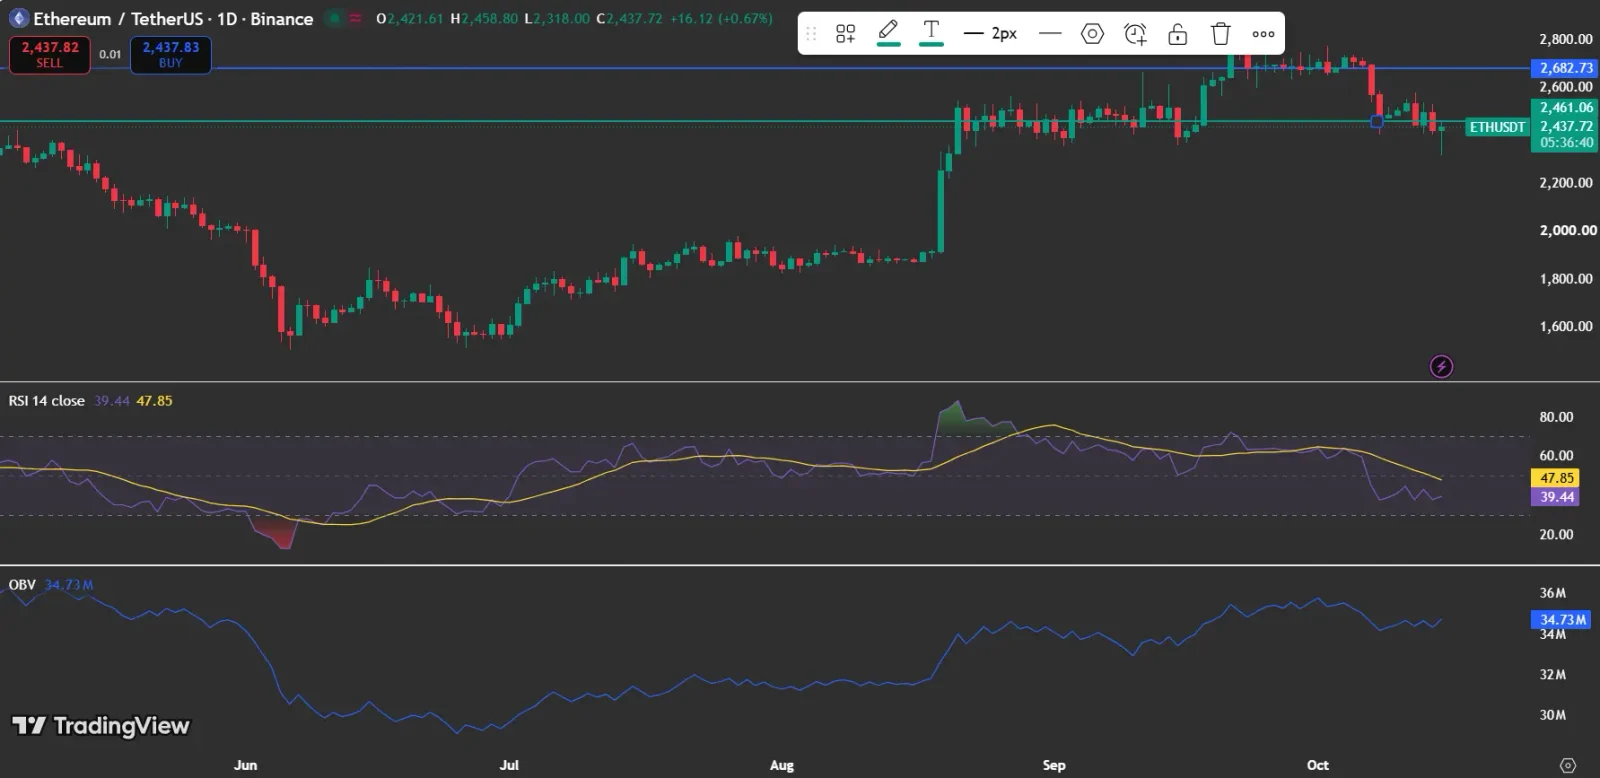
According to the data from TradingView, Ethereum price is at $2,437.72, up 0.67% on the daily candle. Despite this modest recovery, ETH remains below the marked resistance level at $2,682.73, while the RSI indicates that bullish momentum has weakened.
Ethereum price has retreated from its September and early-October highs, suggesting that bearish pressure is building. The recent decline has weakened ETH’s momentum, leaving the price below the marked resistance level of $2,682.73.
The RSI stands at 39.44, below its average of 47.85, indicating that bearish momentum currently outweighs bullish momentum. Meanwhile, the OBV reading of 34.73 million suggests that buying pressure has yet to fully recover from its recent decline.
If Ethereum fails to regain momentum, its price could remain under pressure, increasing the risks for leveraged long positions. A rebound in buying activity could improve the outlook, but the current indicators do not yet confirm a bullish reversal.
Also Read: Ethereum Price: 55% DeFi TVL Powers $32B to 100x RWA Boom
What Does CoinGlass Data Reveal About Ethereum Price?
CoinGlass’s Ethereum open interest chart reveals that derivatives positioning grew sharply in August and remained elevated throughout September. Open interest then declined in October, while ETH’s price also pulled back from its early-October highs.
A decline in open interest may signal that traders are closing positions or scaling back their market exposure. When paired with a drop in price, it can indicate a reduction in outstanding derivatives positions, although the metric alone cannot establish whether traders are closing bullish or bearish bets.
This pattern provides useful context for the whale’s position. Even though the individual trade is sizable, the wider derivatives figures do not independently confirm that buyers are growing stronger.
Also Read: Ethereum Foundation-Linked Wallets Send 4,393 ETH to Kraken
How Does Ethereum Trading Volume Shape the Outlook?
The volume chart from CoinGlass reveals shifts in Ethereum trading activity, including a number of clear spikes from August through October. Such increases point to periods of heightened trading activity, though volume by itself cannot determine whether buyers or sellers drove those sessions.
From a trader’s perspective, growing volume during a price rebound could reinforce a bullish view if the increase accompanies sustained upward price movement. On the other hand, heavy trading during a downturn could indicate increased selling activity.
The available chart does not establish the exact buying or selling pressure behind the most recent price movement. To judge whether Ethereum is attracting new demand or facing ongoing selling, traders would require additional market data showing buying and selling activity.
Also Read: Standard Chartered Launches Bitcoin, Ethereum Trading for UAE Wealth Clients
What Should Ethereum Traders Watch Next?
Because of its size and reported proximity to liquidation, the whale’s position continues to draw attention. Even so, a single trader’s exposure should not be taken as a dependable signal of where Ethereum’s price will head next.
By watching ETH’s price movements alongside open interest, trading volume, and liquidation data, traders can gauge whether market conditions are improving or deteriorating. Shifts in these metrics could offer further insight into leveraged positioning and near-term sentiment.
At present, the available data underscores the dangers tied to highly leveraged Ethereum trades rather than confirming a lasting bullish or bearish trend. Crypto markets remain extremely volatile, so traders should monitor price action, market sentiment, and upcoming catalysts before making investment decisions.
Also Read: Ethereum Price Targets $2,700 in Bullish Breakout Push
This article contains market analysis and price predictions. These are not guarantees. Crypto markets are volatile. Always DYOR. Not financial advice.



Be the first to comment