


Key Highlights
- Ethereum (ETH) price soared by around 5% following aggressive whale accumulation and a rebound in Bitcoin’s price.
- ETH forms a double-bottom pattern on a 4-hour chart with a clear upward trajectory.
- BTC and ETH managed to recover after a sell-off due to hotter-than-expected U.S. inflation data.
On October 16, Ethereum (ETH) price witnessed upward momentum following growing whale accumulation and a rebound in Bitcoin price, helping the cryptocurrency to soar around 5% on a daily chart.
At the time of writing this, Ether (ETH) is trading at around $2,480 with a spike of 4.6% in the last 24 hours, according to CoinGecko. The daily trading volume is hovering around $14.48 billion, along with an impressive market capitalization of $301.764 billion.
Whale Accumulates ETH Despite Uncertainty in Market
According to on-chain data, in the last few days, major whale accumulation took place during a recent pullback in ETH price, with the price trading roughly in the $2,300 to $2,500 range. Some large wallets bought the dip, while others rotated from Bitcoin into ETH.

For instance, Lookonchain has highlighted one whale, which bought 6,010 ETH worth approximately $14.23 million on October 15 amid the price pullback. This same wallet has previously sold 2,050 ETH for around $4.93 million, locking in about $1.08 million in profit, then re-entered at lower levels.
On October 15, another whale accumulated 3,288 ETH at an average price of around $2,450 during the dip. It withdrew 1,100 ETH from OKX at about $2,516.77 and added another 2,188 ETH at approximately $2,416.89.
Whales and institutions sold 1,601.1 BTC, worth about $132 million in USDC, over the last 5 days and used the proceeds to buy 53,095 ETH at an average price of around $2,497. They sold another 288.9 BTC for about $23.48 million USDC and bought 9,820 ETH. This activity was tracked by Yuqing, also known as Yu Jin Monitoring, and confirmed by Lookonchain.
ETH Follows Clear Upward Trajectory
As of now, Ethereum is consolidating in the price range of $2,460 and $2,480. It is up roughly 4% to 5% over the last 24 hours, recovering from an intraday or recent low near $2,300. This price is moving in a clear short-term upward trajectory after the recent sell-off.
Technical indicators also confirm the upward momentum in Ethereum’s price. The 14-day RSI currently revolves around 65. This suggests strong short-term buying momentum without being deeply overbought yet.
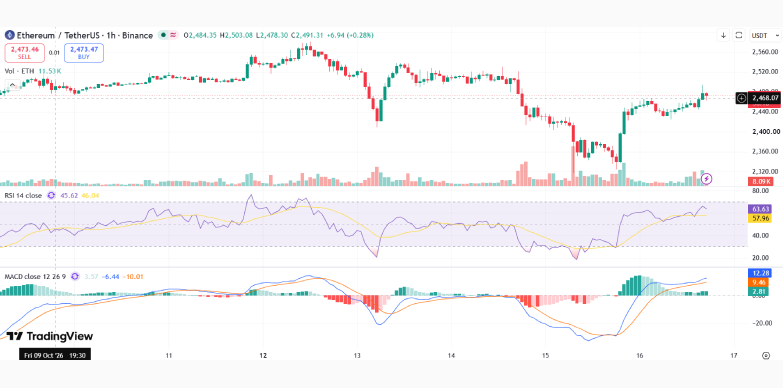
For moving averages, the 20-day SMA sits at around $2,590, with the price currently below it. The 50-day SMA is around $2,550, and the price is also below it. This means ETH is still below its short- and medium-term moving averages. It means that the intermediate trend has not fully turned bullish. However, it is above the rising 200-day SMA, which keeps the longer-term structure intact.
According to the current TradingView price chart, Ethereum is developing a double-bottom pattern, which is especially visible on the 4-hour chart. Two lows formed near the $2,400 to $2,4100 zone, with a deeper liquidity sweep toward $2,320 to $2,340. The neckline and resistance sit around $2,578 to $2,590.
A sustained break and close above this neckline would confirm the pattern and open upside targets toward $2,700 to $2,760. Until then, the recovery remains a bounce rather than a confirmed trend reversal.
Bitcoin Recovers From Fed Rate Ambiguity
On Friday, Bitcoin rebounded on October 16, 2026, recovering around 2% after slipping below $81,000 the previous day. The drop was triggered by hotter-than-expected U.S. inflation data, which heightened uncertainty over Federal Reserve interest rate policy and clearly raised the odds of a potential rate hike,
BTC was trading around $80,000 before climbing back above $82,000. At present, BTC price revolves around $81,980 with a market capitalization of $1.65 trillion.



Be the first to comment