




TLDR
- TIA reached an 11-month high of $0.71 on Oct. 16, up about 28% on the day.
- Trading volume rose 160% to $162 million, and Open Interest climbed 45% to $142 million.
- CoinGlass data showed $1.4 million in short liquidations, while spot exchange inflows hit $2.2 million.
- Weekly RSI reached 64.98, and TIA is trading above its 50-day and 200-day moving averages.
- Celestia launched Eden, an EVM chain built to study agents’ onchain behavior.
Celestia (TIA) has climbed to an 11-month high. The token reached $0.71 on Oct. 16 after bouncing from a $0.52 dip.
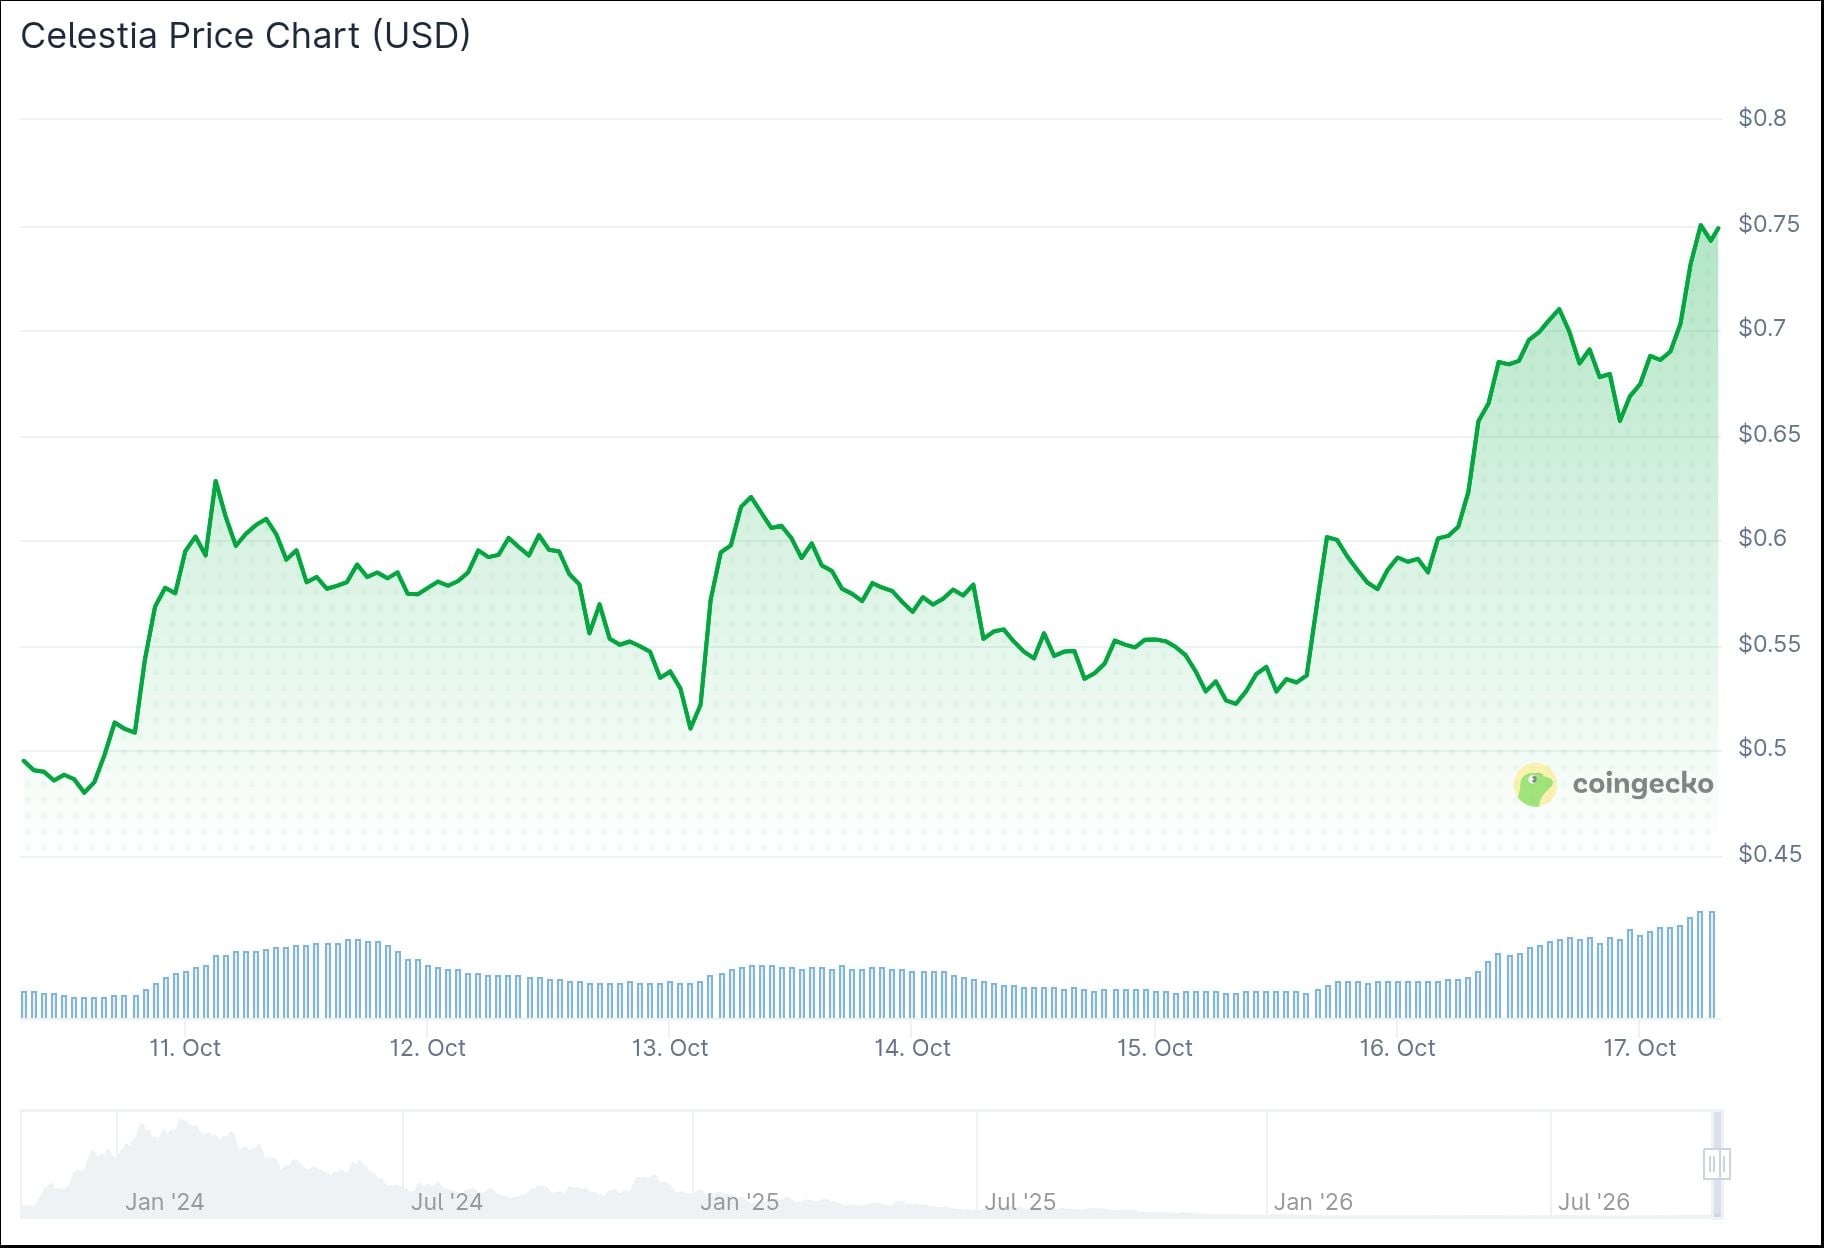
At press time, TIA traded near $0.68 after a 28% daily gain. Trading volume rose 160% to $162 million, which points to more market participation.
CoinGecko said TIA was up 23.5% in 24 hours after Celestia launched Eden. The project describes Eden as an EVM chain built to study agents’ onchain behavior.
$TIA is up 23.5% in 24h after Celestia launched Eden, an EVM chain built to study agents’ onchain behavior. pic.twitter.com/u3QXB5nPuI
— CoinGecko (@coingecko) October 17, 2026
Analyst Rekt Capital said in an Oct. 16 post that TIA confirmed a breakout from its “Macro Accumulation Range.” He added that the token had rallied 50% since it was discussed in his Altcoin Watchlist.
Derivatives Activity Picks Up
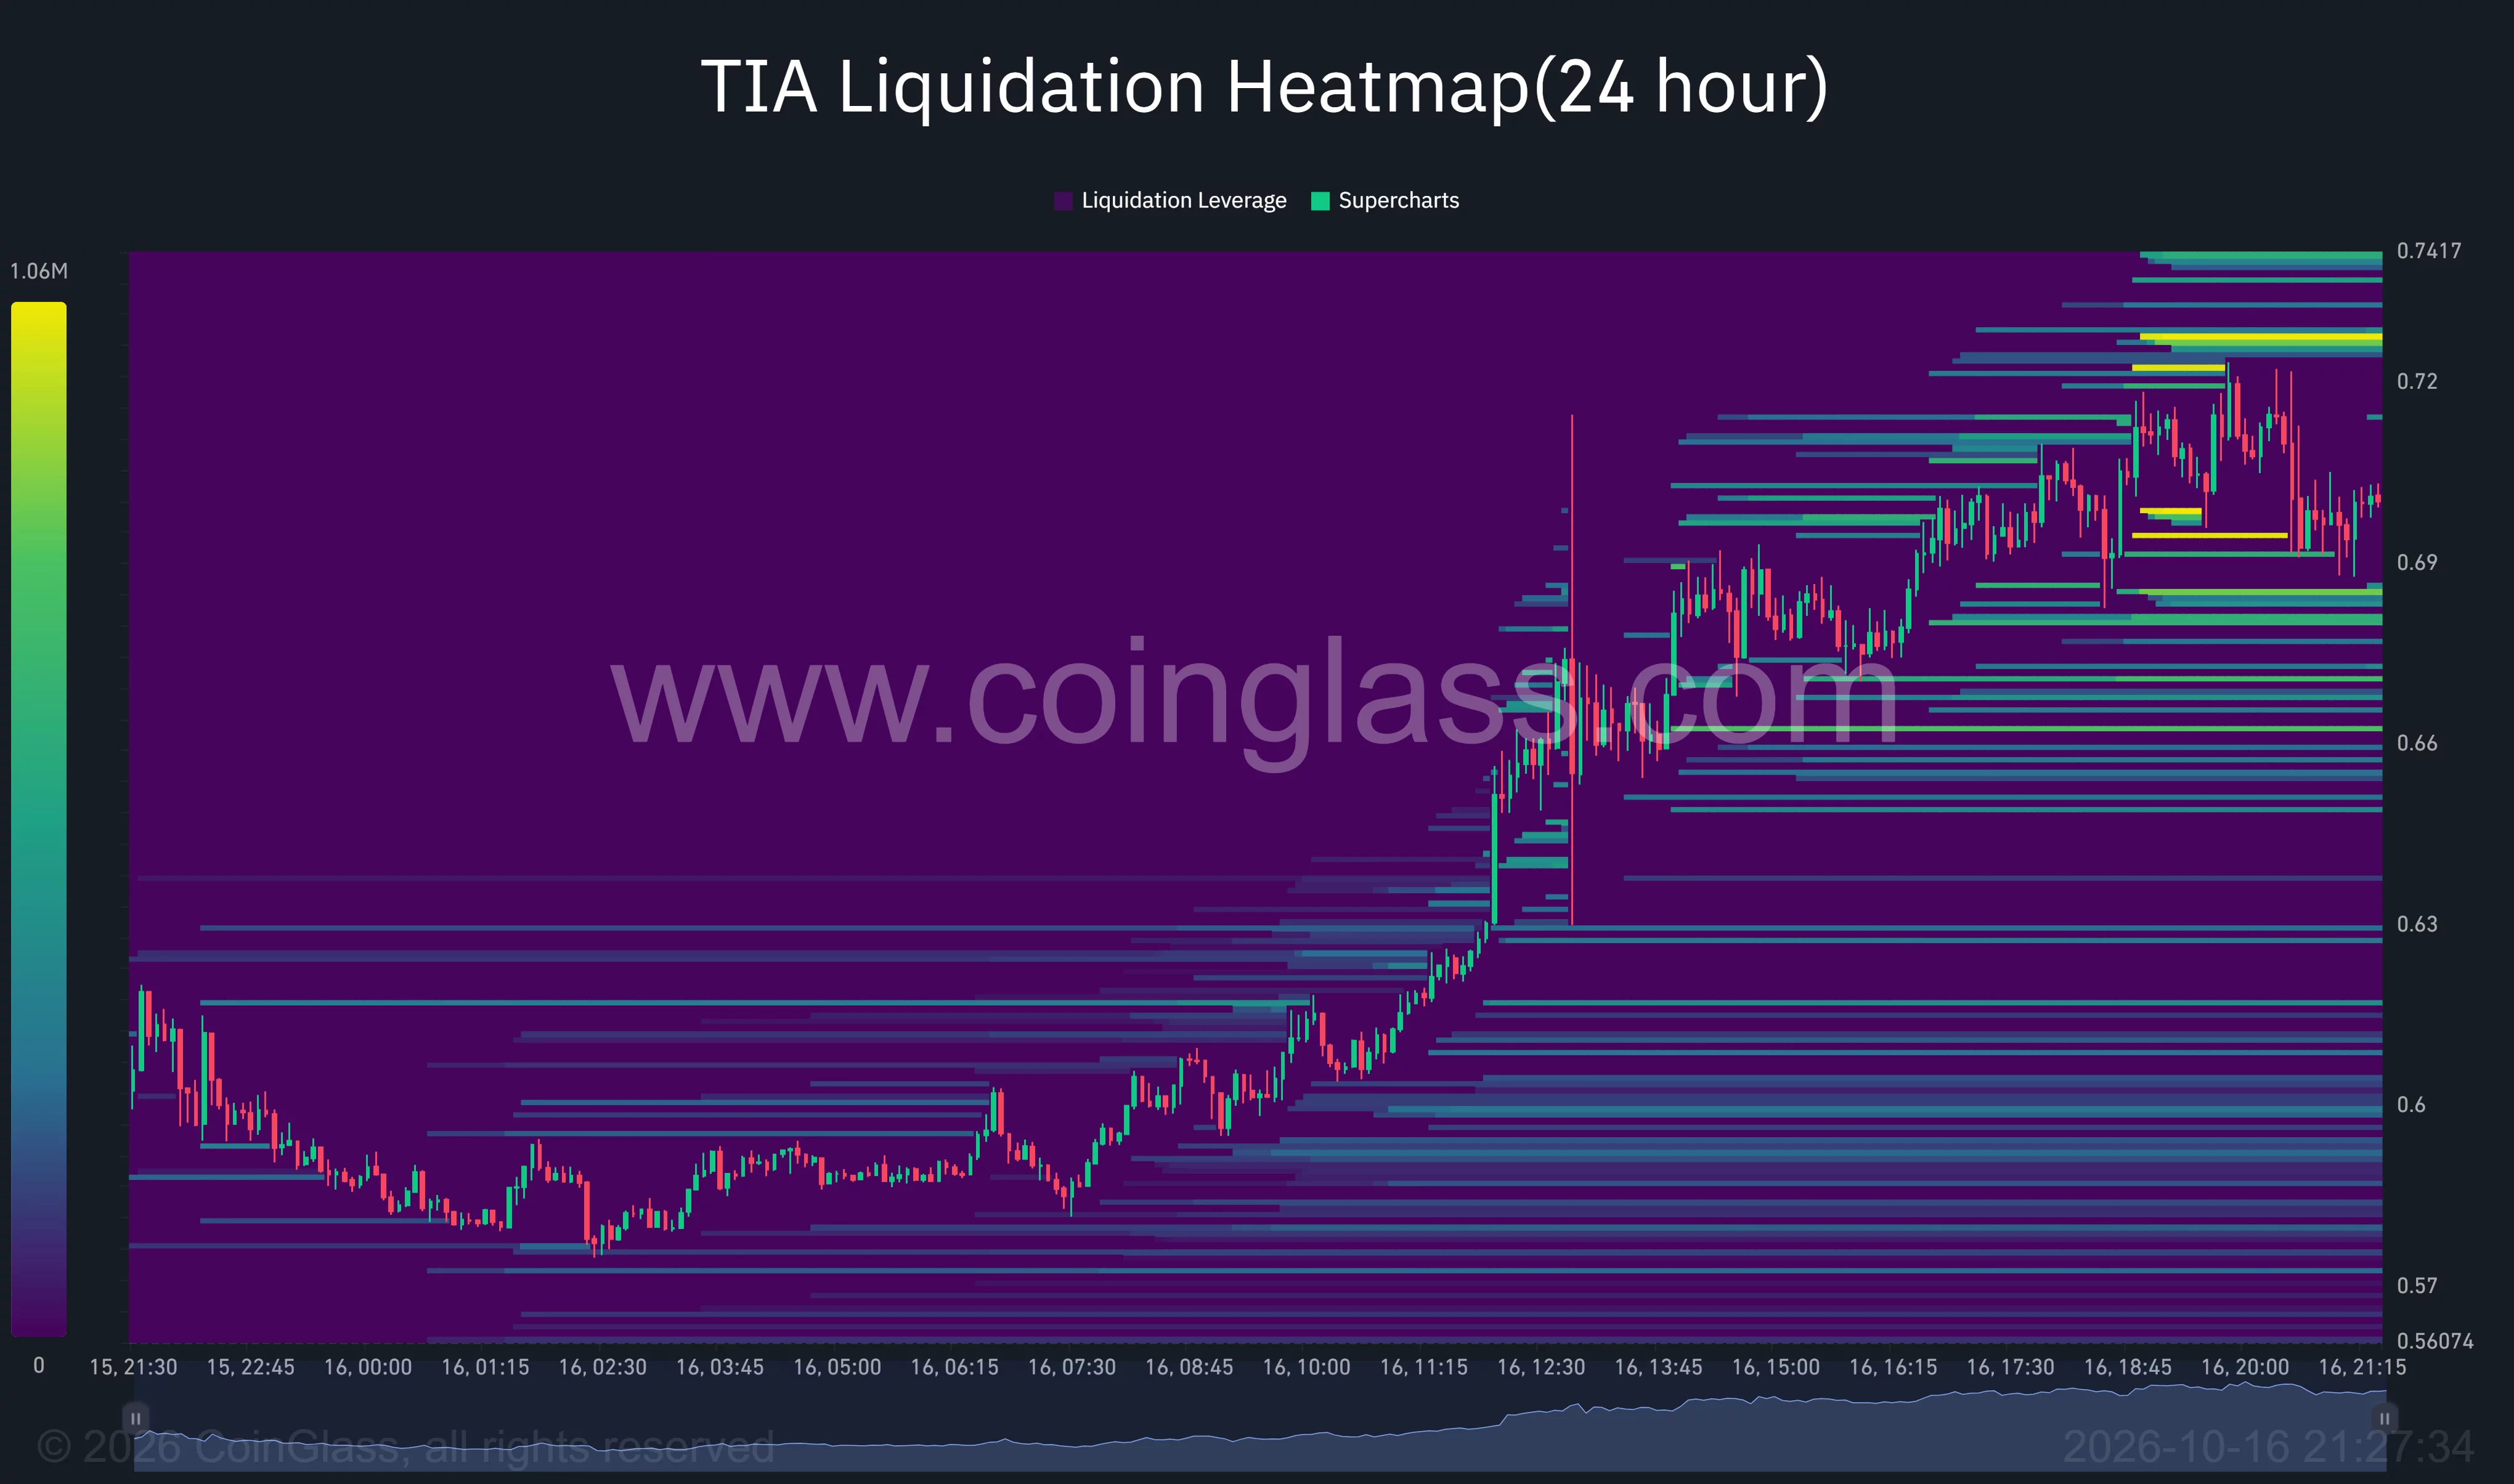
The rally forced out traders who bet on a price drop. CoinGlass data showed $1.4 million in short liquidations.
Open Interest rose 45% to $142 million. A 110% jump in volume backed that increase.

On Binance, Perps Buy Volume reached 90 million against 89 million in Sell Volume. That suggests buyers held a slight edge.
Spot sellers were also active. On Oct. 16, Celestia’s spot netflow hit a record $2.2 million, meaning more tokens moved onto exchanges than off them.
Chart Analysis
On the daily chart, TIA spent much of the spring and summer between $0.30 and $0.40. It then built higher through September and October, passing rebounds that stalled near $0.45 to $0.50.
The 50-day moving average sits at $0.4394, above the 200-day at $0.3820. The daily MACD reads 0.0504 against a signal line of 0.0368. On the weekly chart, RSI is 64.98, below the overbought level of 70, and Supertrend is bullish.
The CoinGlass heatmap shows a cluster of liquidations near $0.725 to $0.73. A move through that band would bring $0.74 into view. Traders will watch whether TIA holds above $0.66 to $0.68.
Momentum and Fibre Test
The ADX positive index rose to 31, while the negative index fell to 7. Aroon Up climbed to 100%. These readings point to strong upward momentum.
If momentum holds, TIA could reclaim $0.70 and aim for $0.80, where the trend broke down last November. A failure to hold could send it back toward $0.50.
On Oct. 1, Celestia Labs reported that Fibre sustained 3.07 terabits per second across 120 validators in a 143-second benchmark. The team said the test used an experimental branch. The latest price move cannot be tied to that news alone.
Celestia also reclaimed 43 million TIA from Polychain in a buyback deal. On Oct. 16, TIA traded near $0.702 after a session high of $0.7233.



Be the first to comment