


Solana has steadied near $105 after testing the $100 area identified in the previous analysis. The more important question now is whether the rebound can recover $109.4–$109.7 – the moving-average and Fibonacci cluster lost during the breakdown.
SOL traded at $105 on October 17 at 07:41 UTC, up 0.66% on its open daily candle. The session ranged from $103.9 to $105.1, leaving the token about 16% below the measured rally high of $124.9.
Chart in one sentence: $100 has held for now, but SOL has not repaired the breakdown until it first recovers $109.7 and then reclaims the former rising channel floor above it.
The earlier $100 objective has been tested
Our previous Solana analysis, published on October 13, identified the loss of the ascending channel and support near $109 as reasons to watch the $100 area. That reading recorded an intraday low of $101.7, just above the 38.2% Fibonacci retracement near $100.2.
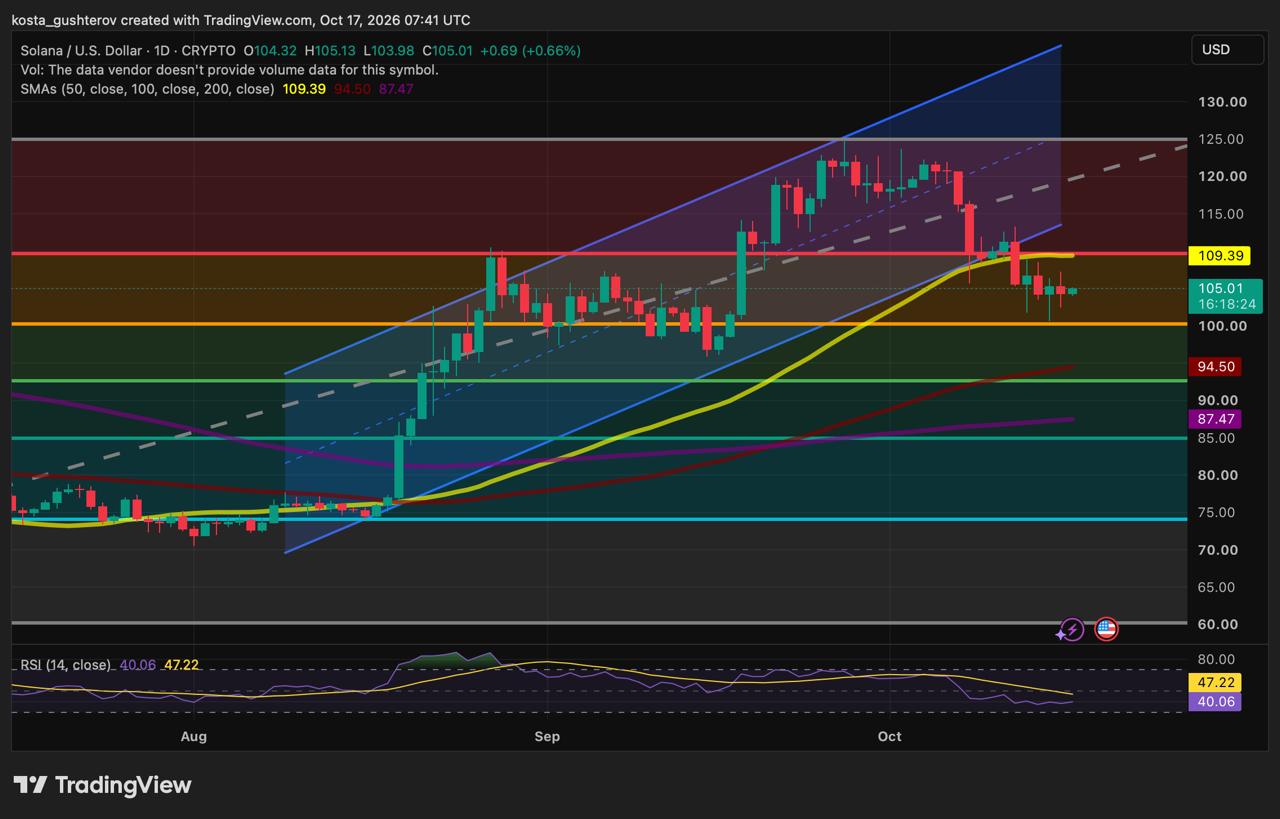
The updated chart shows another lower wick extending closer to the same retracement before SOL moved back toward $105. Its exact low is not labelled, so the chart supports describing an approach to the $100 band rather than claiming a confirmed touch of both levels.
For now, SOL is holding above the latest low rather than directly retesting $100 in the current session. The overlap still gives the area weight: $100 is a widely watched round number, while $100.2 marks the 38.2% retracement of the preceding advance. Recent lower wicks show buyers responding after intraday weakness, but not how much demand would remain if price returns again.
The rebound has two barriers, not one
The first sits at $109.4-$109.7, where the 50-day simple moving average and the 23.6% Fibonacci retracement nearly overlap. A daily close above that narrow cluster would return SOL above both a short-term trend reference and a shallow retracement level.
That would improve the recovery, but it would not fully restore the former uptrend. The lower boundary of the broken ascending channel slopes upward and now sits above the horizontal $109.4-$109.7 area. SOL would need to reclaim that boundary separately to move back inside the channel that guided its earlier advance.
In plain terms, recovering $109.7 would show that buyers have retaken nearby resistance. Recovering the channel floor afterward would show that the broader rising structure has been repaired. Until both happen, the bounce can still fade within the correction.
If SOL clears those hurdles, the $115-$120 area becomes the next trading range to watch. The measured rally peak near $124.9 remains the higher resistance reference.
If $100 fails, the longer averages move into focus
A daily close below $100–$100.22, followed by an unsuccessful attempt to recover the band, would weaken the case that SOL is stabilizing around its current range. Attention would then turn to the rising 100-day SMA at $94.50 and the 50% Fibonacci retracement at $92.59.
Those levels are close enough to form a support range roughly $1.90 wide, but they are not the same level. A move below $94.50 could still find a response near $92.59; a sustained decline through both would provide stronger evidence that the correction is broadening.
The next lower references are the 200-day SMA at $87.47 and the 61.8% Fibonacci retracement at $84.95. The chart can identify the levels where price may react, but it cannot show how much demand is waiting there or guarantee that either will hold.
The 100-day and 200-day averages are still rising beneath SOL, while the 50-day remains above both. That ordering reflects the preceding advance. SOL trading below the 50-day average, however, shows that the shorter-term trend has deteriorated first.
Momentum has not caught up with the price bounce
The daily relative strength index, or RSI, reads 40.06, below the neutral midpoint of 50 and its smoothing line near 47.22. That is consistent with weaker momentum after the channel break. RSI remains above the conventional oversold threshold of 30, and the chart does not show a clear bullish divergence that would confirm a reversal.
An RSI move back above 50 would be more meaningful if it occurred alongside a daily close above $109.67. On its own, a small improvement in the indicator would not resolve the price resistance overhead.
The chart’s data provider does not supply volume for this symbol. There is therefore no volume evidence here to confirm that the rebound is attracting broader participation or to measure the buying behind the lower wicks.
What bulls need
SOL needs a daily close above $109.4-$109.7, followed by a successful retest of that cluster as support. Reclaiming the rising channel boundary afterward would strengthen the case for a move toward $115-$120.
What would weaken the bounce
A close below $100 followed by a failed recovery would shift the focus to $94.50-$92.59. Only if that entire range gives way would $87.47-$84.95 become the next lower chart area.
This article is provided for informational purposes only and does not constitute financial or investment advice. Technical levels and indicators are interpretive tools, not guarantees of future price movement.

Alex is Editor-in-Chief of Coindoo and co-founder of Millennial Media Group, with nearly a decade of experience covering financial markets – crypto first, then everything else.
It started in 2016 with Bitcoin. Like most people at the time, he didn’t fully understand it – so he kept digging. Blockchain, tokenomics, the projects, the cycles. That curiosity never stopped, and eventually pulled him into traditional markets too: equities, commodities, macro. Not because he left crypto behind, but because you can’t properly understand one without the other.
What drives him is straightforward: he wants to know why something is happening, not just that it’s happening. Most market coverage stops at the headline – price up, price down, here’s a chart. Alex finds that kind of reporting actively unhelpful. If you walk away from an article without understanding the mechanism behind the move, what did you actually learn?
He holds a degree in Tourism from New Bulgarian University – not the most obvious path into financial markets, but markets have a way of pulling in people who are simply too curious to stay out. He has authored over 200 in-depth analyses and more than 10,000 articles across crypto and traditional finance. He still thinks every day in markets teaches him something new. That’s probably why he hasn’t stopped.



Be the first to comment