



Ethereum traded at $2,416.88 on Saturday evening, barely changed from the day before. The more important figure of the day does not sit in the chart: the supply of ETH grew by 2,955 units over the past 24 hours, while 13.59 ETH were burned in the same period. That is 0.46 percent of the newly created amount. The mechanism that earned Ethereum the nickname “ultrasound money” between 2021 and 2023 has thus become close to ineffective.
cryptoticker.io compiled this analysis itself on October 17, 2026, on the basis of the public supply and burn data from ultrasound.money and the fee statistics from DefiLlama. Where the price can point over a horizon of months is set out in our Ethereum price prediction.
The supply grows while the burn dries up
Ethereum’s circulating supply stands at 122,137,960 ETH. Thirty days ago it was 122,051,481 ETH. That makes 86,479 ETH added this month, worth around $215 million in new supply at the current price. Over seven days it was 20,611 ETH, over 24 hours 2,955 ETH.
Set against that is the burn. Over 30 days it came to 2,460.75 ETH, over seven days to 213.54 ETH and over 24 hours to 13.59 ETH. Add the growth and the burn together and about 2,969 new ETH arise each day. Less than one two-hundredth of that is currently destroyed again.

Gross issuance and burn: the two figures that set the supply
Two processes determine how much ETH exists. Issuance is the amount the network pays out afresh each day, as a reward to the validators that propose and attest blocks. The burn is the amount irretrievably destroyed with every transaction: since the EIP-1559 fee reform of August 2021, a block’s base fee is taken out of circulation instead of being paid to the validators.
The decisive point is the coupling. Issuance is stable and depends on how much ETH is staked in total. The burn, by contrast, depends on how heavily the network is used. When blocks are full, the base fee rises and a great deal is burned. When little is happening, the base fee falls to a minimum and the burn runs into the void. That is exactly the state of play today.

Network fees have fallen 54 percent within a day
The cause sits in the fee statistics. Ethereum took in $213,212 in network fees over the past 24 hours. The day before it was $466,000, a decline of 54.37 percent. At the peak of the past week, on October 13, daily fees stood at $467,282, which is 2.2 times today’s figure.
Behind it lies a development that has been under way for some time. Since Ethereum introduced data blocks for layer 2 networks, the bulk of activity has moved to Arbitrum, Base, Optimism and other networks built on top of Ethereum. Those networks pay considerably less for their data than ordinary transactions on the main blockchain do. That is technically intended and cheap for users, but it removes the basis for the burn.
What has changed since the last Ethereum forecast
On October 16 our Ethereum forecast on the options market reported that the derivatives exchanges were pricing in annual volatility of 51 percent, and that an upper band of $2,756 followed from that arithmetically. Since then the price has fallen from $2,439.96 to $2,417.05, by $22.91 or 0.94 percent. The upper range has therefore not come closer in those two days; the price has instead pushed to the lower edge of the monthly range.
What this article adds is new: on October 16 the burned share over seven days was still noticeably higher than today’s figure over 24 hours. The supply side has therefore deteriorated over the same period in which the price side moved sideways.
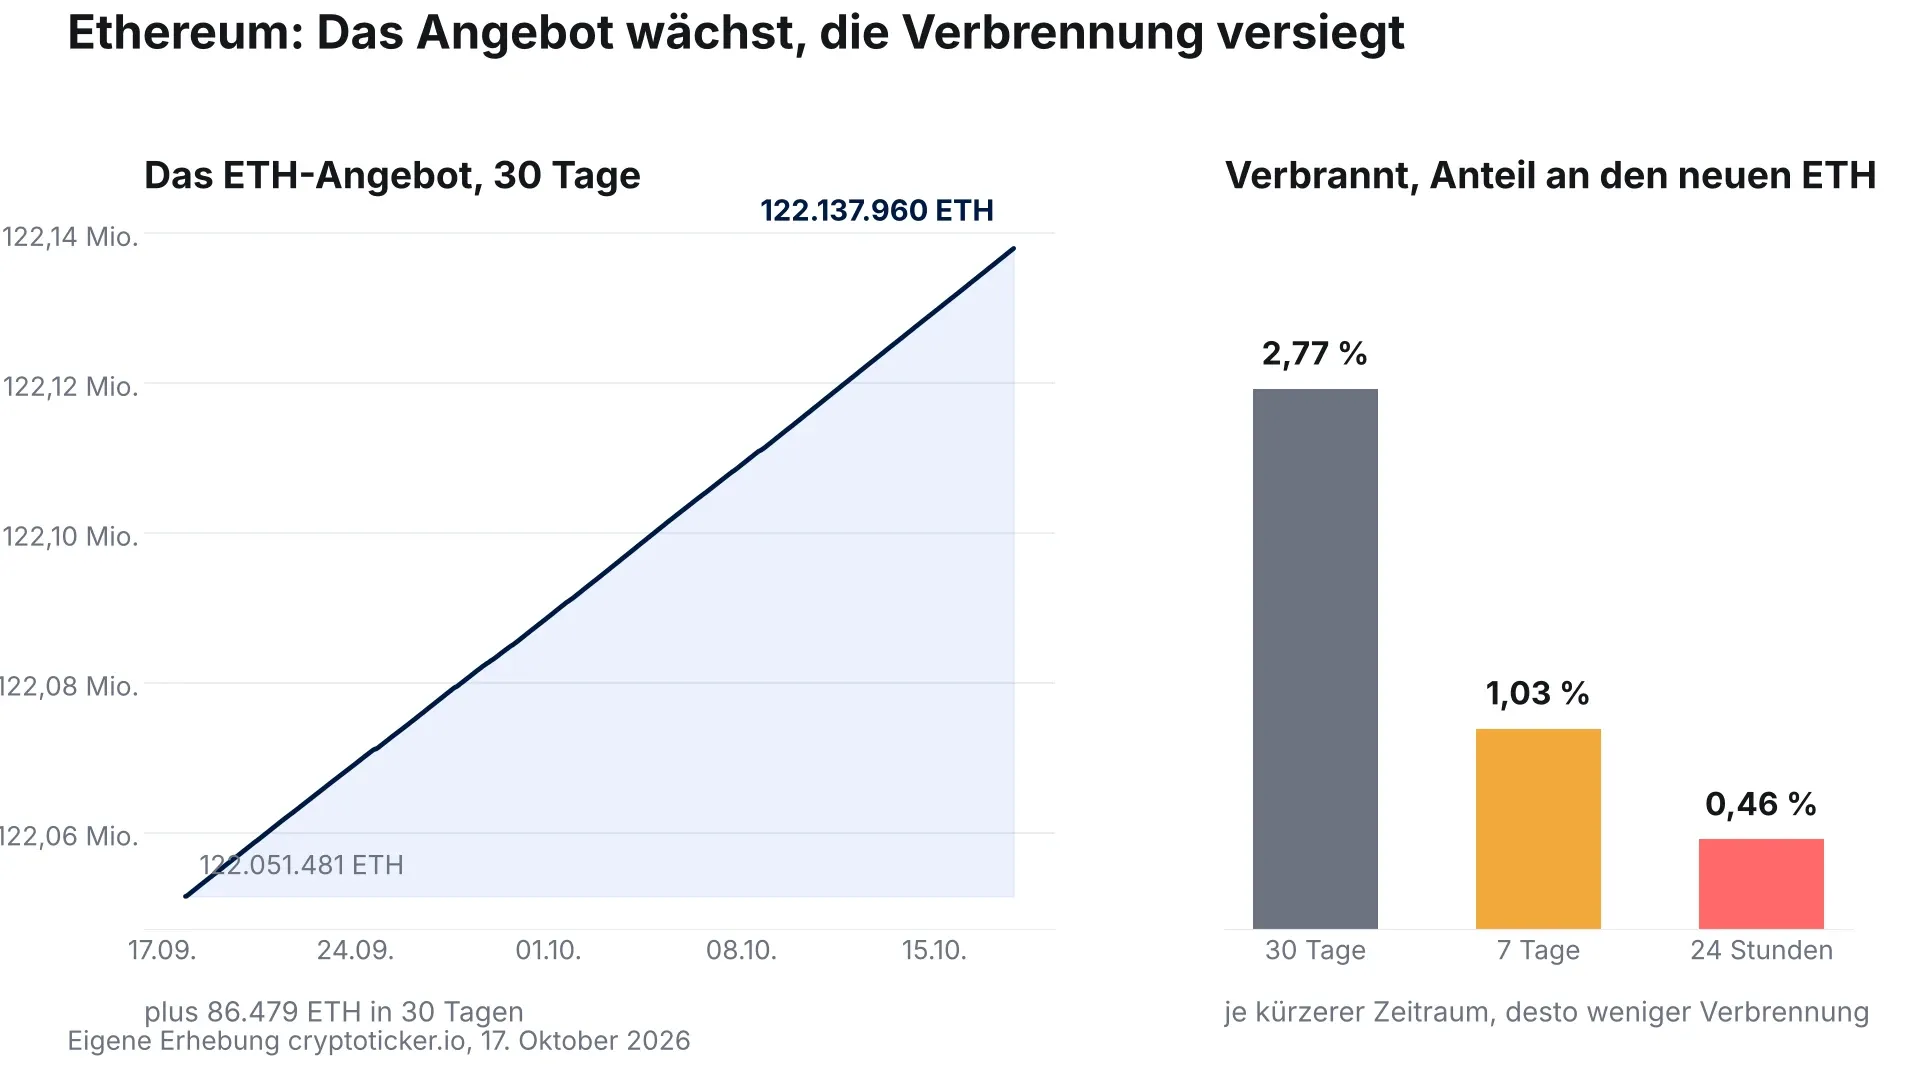
0.46 against 2.77 percent: the decay across three time frames
The comparison across three periods shows this is not a single quiet day. Over 30 days, 2.77 percent of the newly created ETH was burned again. Over seven days it was 1.03 percent. Over the past 24 hours, 0.46 percent. The share has therefore roughly halved in each shorter window.
For a sense of scale: since the switch to proof of stake in September 2022, 2,017,726 ETH have been burned, while the circulating supply grew by 1,616,921 ETH over the same period. The network has thus paid out around 3.63 million ETH in those four years, and the burn has absorbed a good half of it. Since EIP-1559 was introduced in August 2021, the burn adds up to 4,641,036 ETH, worth $13.11 billion. Almost nothing of that effect is left at the moment.
The levels: $2,397 below, $2,552 above
Four values count for the coming days, and each of them can be derived from the price data of the past 60 days. On the downside sits Saturday’s daily low at $2,397.77. Above it, at around $2,417, lies the lowest daily level of the past 30 days, set on Saturday and thereby just undercutting the previous low of October 15 at $2,419.69.
On the upside the first target is the weekly high of October 12 at $2,534.63. Above that follows the average of the past 50 daily closes at $2,551.85, which cryptoticker.io calculated from the daily prices itself. That line describes the midpoint of the price action of recent weeks: as long as the price stays below it, Ethereum is trading under its own two-month average. The monthly high sits at $2,775.17 and therefore 14.8 percent above the current level.
Our assessment: a growing supply is a headwind, not a sell signal
In the view of this newsroom the supply side is currently a measurable headwind for the price, but one of modest size. The evidence stands above: 2,969 new ETH a day equal around $7.18 million at the current price. Extrapolated over a year that is just under 1.08 million ETH, or 0.89 percent of the circulating supply. By way of comparison, Bitcoin has run at an annual issuance of under one percent since the halving of April 2024. Ethereum has therefore not suddenly turned inflationary in the sense of conventional currencies, but the scarcity story of 2022 and 2023 no longer holds.
Against that, the historical link between issuance and price is weak. In the months with the strongest burn, Ethereum did not automatically stand higher, and the 86,479 ETH of the past month are a small quantity measured against daily trading volume. Deriving a sell signal from that figure overstretches it. Something else is solid: if network usage rises again, the burn returns, and quickly, because it hangs directly on the base fee. The finding of this article is therefore a snapshot of network activity rather than a structural break.
Where the new ETH land: staking and the role of the validators
The roughly 2,969 new ETH a day go to validators rather than to miners. A validator is a participant who has deposited 32 ETH and in return proposes and attests blocks. Anyone unwilling to raise 32 ETH or run a node can take part through providers that pool deposits. The largest of them, Lido, currently manages deposits worth $23.42 billion according to DefiLlama data.
Three things count more than the advertised yield when choosing a provider: how long it takes to get your ETH back, who is liable if the network imposes a penalty, and what share of the earnings stays with the provider. An overview of the terms sits in our comparison of staking platforms. What matters here is that the distributed earnings come from precisely the issuance that makes the supply grow: what flows to one holder as yield raises the circulating amount for everyone else.
Staking rewards and the holding period: what applies in Germany
For investors in Germany there is a tax side to this. Staking rewards count as other income under the administrative view and are taxable in the year they accrue, valued at the price on the day of receipt. The threshold for that is 256 euros a year; once it is exceeded, the entire amount becomes taxable. The staked ETH themselves remain subject to the one-year holding period, after which a gain on sale stays tax free. We record the current state of the debate on that deadline under crypto holding period.
In practice that means the following: anyone receiving small staking amounts each month accumulates many individual receipts, each with its own price and its own date. Tracking that by hand quickly becomes unmanageable once several providers are involved. Tools that value receipts automatically and produce a schedule for the tax return are set side by side in our comparison of tax software.
The next dates that could move the burn
Two things would change the figures in this article. The first is a return of activity to the main blockchain, for instance through a phase of high volatility in which many users trade and reposition at the same time. That feeds through to the base fee, and so to the burn, within hours. The second is the work on the next network upgrade, whose client versions have been available since October 16 and which is meant to raise capacity for layer 2 data further. More capacity means lower fees at unchanged demand, and therefore a tendency towards even less burning.
Both can be watched without waiting for announcements: daily fees and the burned amount are publicly visible and are updated every day.
ETH supply: without fees the burn stays below 0.5 percent
The finding of October 17 is that Ethereum pays out around 2,969 ETH a day and destroys 13.59 of them again. Three concrete steps follow from that:
- Read the supply figure alongside the price. Holders of Ethereum should follow the burned amount as well as the price. If it climbs clearly above 100 ETH a day over several days, network activity is returning, and that is the first signal that runs ahead of the price.
- Note the levels. On the downside $2,397.77 and $2,417 are the tests, on the upside $2,534.63 and the two-month average at $2,551.85. Staggering purchases then rests on four points instead of instinct. Venues and their fees are listed in our comparison of crypto exchanges.
- Record staking rewards cleanly. Every receipt counts at its price on the day it accrues, and the threshold is 256 euros a year. Keeping that up as you go saves the reconstruction in spring.
(As of October 17, 2026. This article is not investment advice. Prices and fee structures change; check the terms with the provider before you buy.)





Be the first to comment