


Bitcoin trades near $81,800 as analysts watch $80.7K support, an $86K breakout level and a possible drop to $75.5K. Key BTC levels explained.
Bitcoin (BTC) trades near $81,800, and its next big move hinges on one level. Analysts say a hold above $80,700 keeps the path open to $86,000, while a daily close below it could send BTC back to $75,500.
CoinGecko data shows BTC up 0.55% in 24 hours but down 1.16% over seven days. Traders now need to know whether buyers can defend support and clear resistance near $83,500.
CoinGecko lists Bitcoin at $81,778.53, with 24-hour trading volume of about $15.8 billion. The weekly dip is small, and price is moving sideways rather than trending.

Analyst Don (@DonWedge) says BTC has retested the $80,700 top of its consolidation box and held. He notes the level has held since the September breakout. In his words, old resistance is now support.
$BTC → box top at $80.7k retested again and held, now $82.1k
old resistance, now support
next resistance → descending line at $86.2k
daily close below $80.7k → back inside the box, $75.5k box bottom nextlevel held since the September breakout pic.twitter.com/XVG5fOYEZ0
— Don 🐂 (@DonWedge) October 18, 2026
The daily chart adds context. BTC rallied from the $63,00-$65,000 region in August, but the recovery has stalled near $82,00-$83,000. Buyers have not yet produced a decisive close above that zone.
What Technical Indicators Say About BTC Momentum
The Ichimoku Cloud gives mixed signals. Ichimoku is a trend system built on average price levels over set periods.
BTC trades slightly below its short-term Tenkan-sen line at $82,076 and below the Kijun-sen baseline at $83,539, which acts as overhead resistance. The projected cloud is green, which supports the broader recovery.
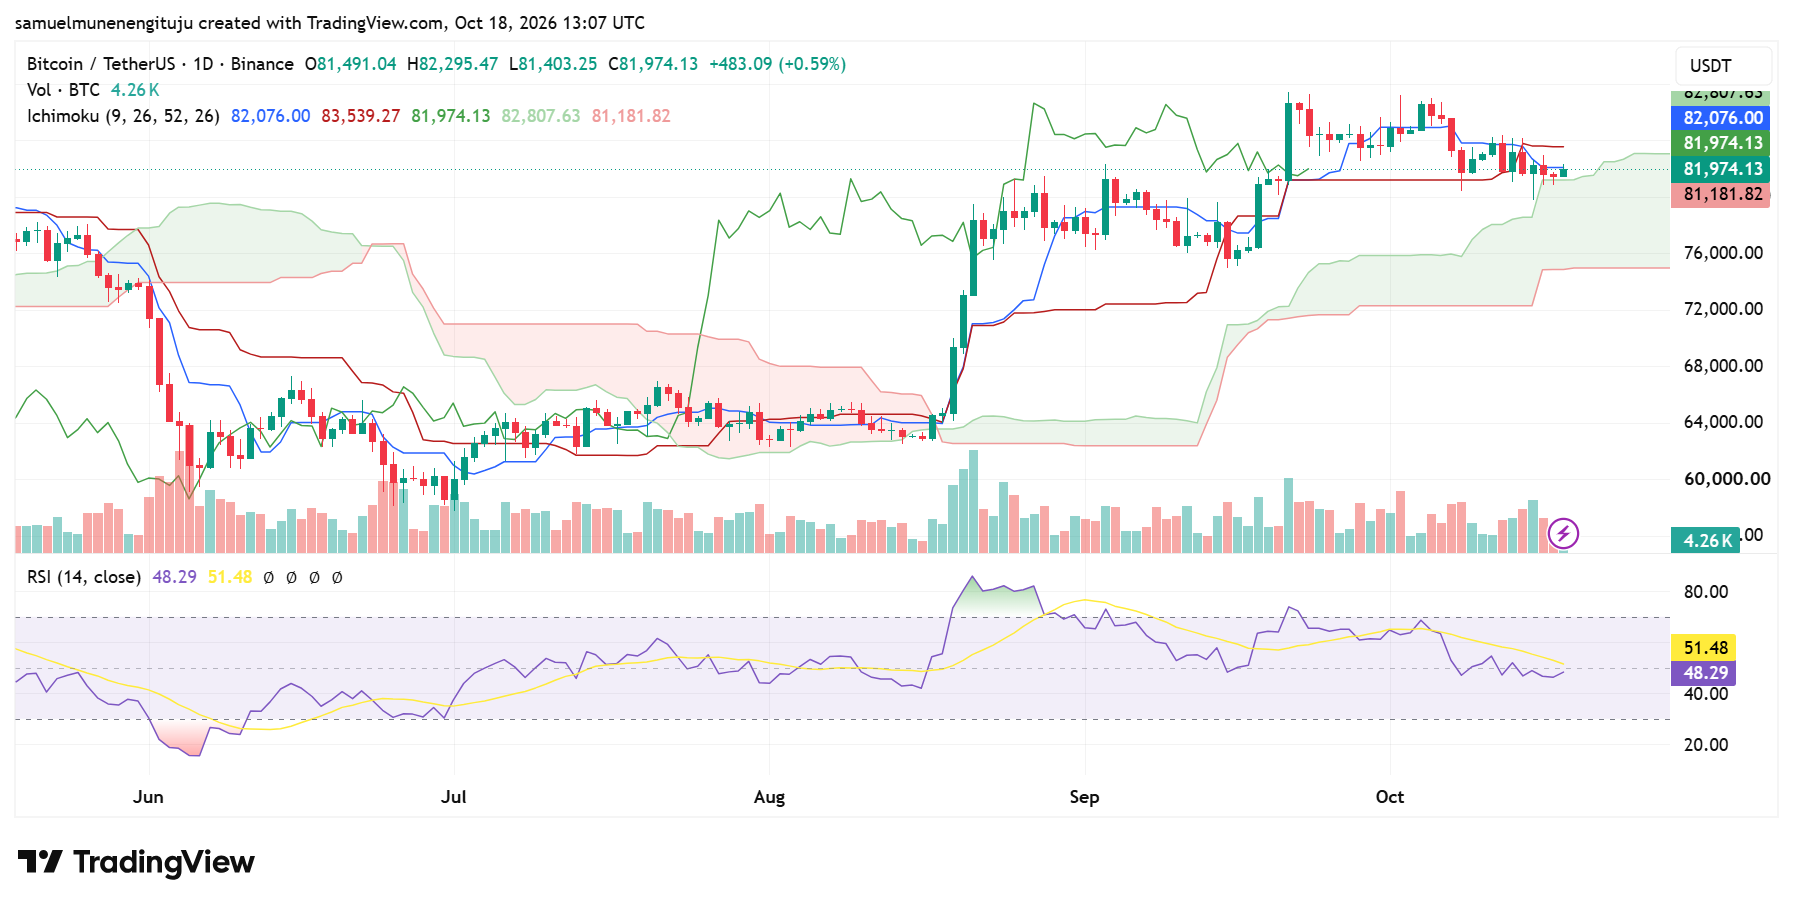
Momentum is soft.
The 14-day Relative Strength Index (RSI), which measures the speed of price moves on a 0–100 scale, reads 48.29. That sits below the neutral 50 mark and under its own moving average of about 51.48. It is far from the oversold level of 30, so there is no bounce signal.
Volume tells a similar story.
Activity surged during the August breakout but has been moderate lately. A move above $83,500 on thin volume would carry less weight than one backed by rising participation.
Bitcoin Price Scenarios: Breakout, Range or Drop to $75.5K
The bullish case needs a daily close above $83,500, ideally on rising volume. That would put $85,000 and Don’s descending trendline near $86,200 in play.
Analyst Mister Crypto (@misterrcrypto) says sell orders look relatively thin until $87,000. Order books change quickly, so thin sell orders do not guarantee a rally.
$BTC whale buy orders are stacking up below us.
Major buy clusters sit between $70,000 and $80,000, while sell orders are relatively thin until $87,000.
Bitcoin could test the highs first before another pullback.
But if we revisit those buy clusters, they could provide strong… pic.twitter.com/LUjimyWk5o
— Mister Crypto (@misterrcrypto) October 18, 2026
A sideways range between $81,000 and $83,500 is also plausible. In that case, RSI would likely hover around 45–55 while buyers and sellers compete.
The bearish case begins with a daily close below $80,700. Don says that would put BTC back inside its box, with the $75,500 box bottom next. Chart support at $79,000-$80,000 and $76,000-$77,000 would be the first areas to watch.
Mister Crypto says whale buy clusters sit between $70,000 and $80,000. If BTC revisits them, he argues, they could provide strong support and form the next higher low. He also expects BTC could test the highs first before another pullback.
Watch a daily close above $83,500 for bullish confirmation and $80,700 for downside risk.



Be the first to comment