




TLDR
- Bitcoin is trading near $82,663, up about 0.8% after last week’s dip below $80,000.
- U.S. spot Bitcoin ETFs lost $228.6 million last week, down from about $679 million the week before.
- BTC trades in a range between $79,676 and $87,397, with RSI near neutral at 51.35.
- Glassnode data shows more than 70% of supply in profit and limited holder capitulation.
- Markets await the Fed’s Oct. 28 decision, and Strategy faces a possible MSCI index removal.
Bitcoin (BTC) is trading near $82,663 on Monday, up about 0.8% on the day. Buyers are trying to recover after last week’s drop below $80,000.
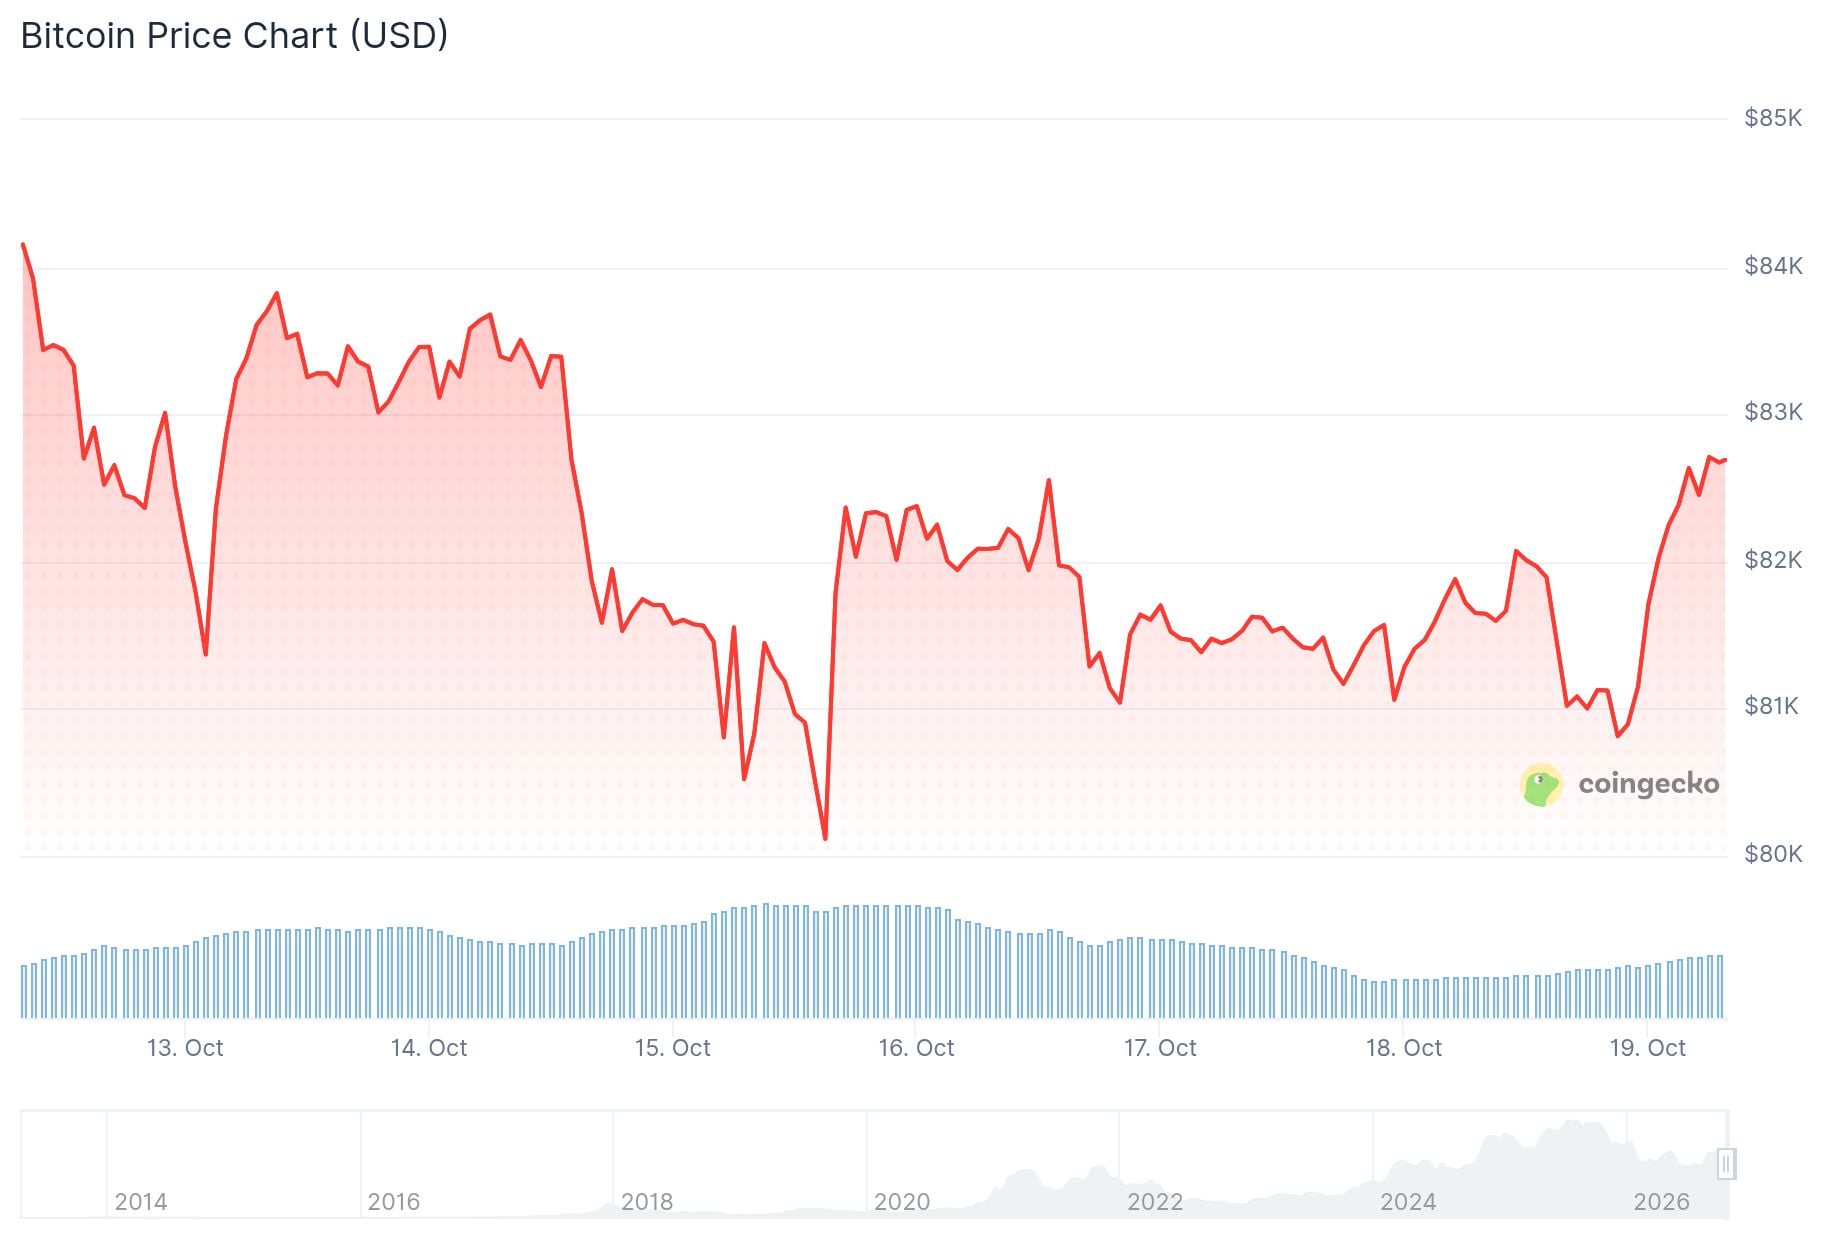
BTC opened near $82,007 and reached about $82,780. It dipped to roughly $81,902 before recovering.
Last week, Bitcoin touched a four-week low near $79,770 during a risk-off selloff. Price now sits inside a range between about $79,676 and $87,397.
Chart Analysis: Bitcoin Holds the $80K Floor
BTC slipped under the rising trendline from August, so the short-term structure looks softer. Still, the $79,676 range floor keeps doing its job, and dip buyers keep showing up there.
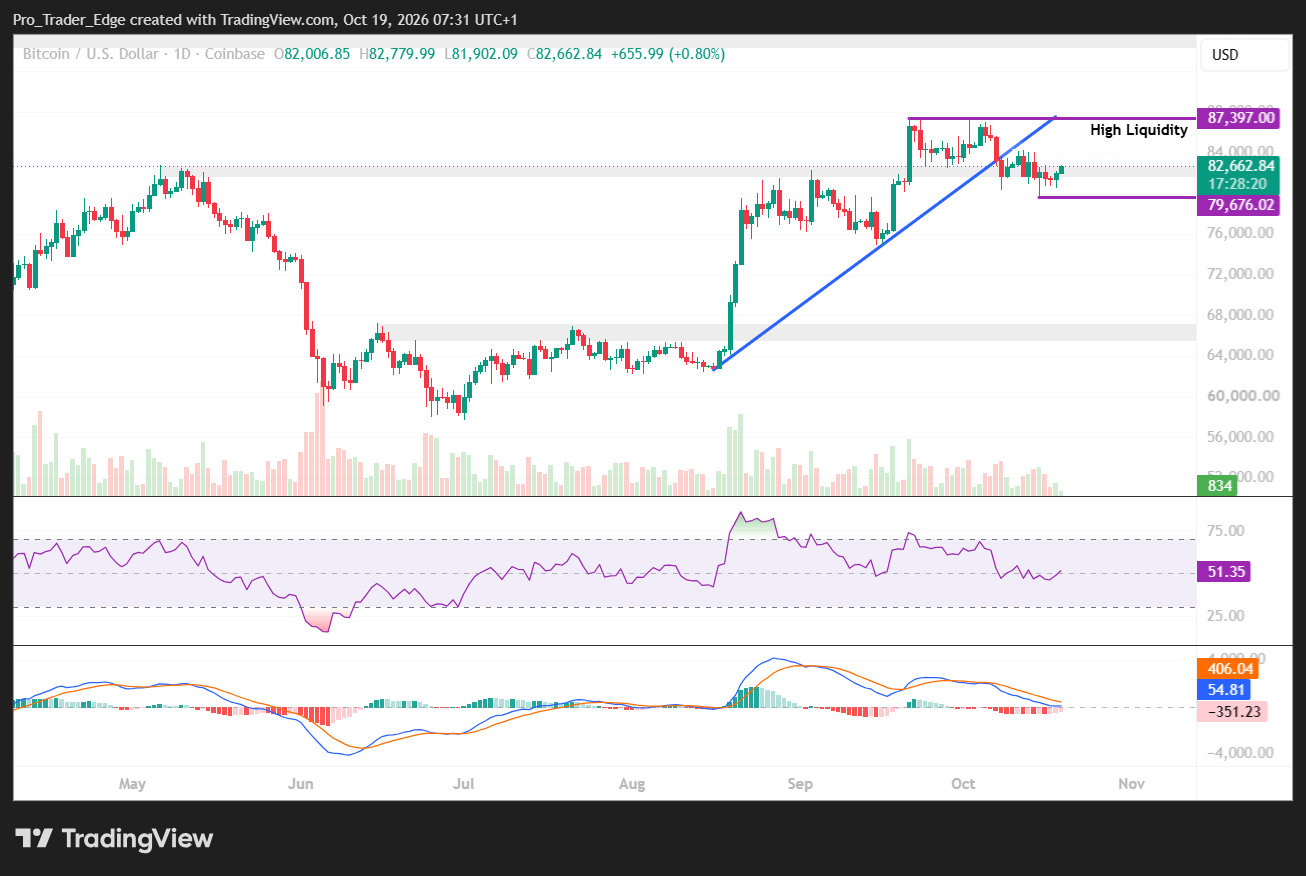
Daily RSI is 51.35, which is close to neutral. MACD is still bearish, so this bounce hasn’t confirmed a reversal. Watch next: a daily close above $84,000-$85,000 puts the $87,397 resistance back in play.
Barchart posted on X that Bitcoin is coiling, with one of the tightest Bollinger Band widths in the last 2.5 years. The post suggests a larger move could be coming.
Bitcoin $BTC coiling and could be gearing up for a big move 🚨 One of the tighest Bollinger Band widths in the last 2.5 years 👀 👀 pic.twitter.com/etpgUNHRWt
— Barchart (@Barchart) October 19, 2026

Glassnode puts the average U.S. spot ETF cost basis near $81,500. That makes the $79,700-$81,500 area a key support zone.
ETF Outflows Slow as On-Chain Data Holds Up
U.S. spot Bitcoin ETFs saw $82.4 million in net outflows on Oct. 16. BlackRock’s IBIT lost $71.8 million and Fidelity’s FBTC lost $10.6 million.
For Oct. 12-16, the funds lost about $228.6 million. The week before, withdrawals were around $679 million.
Daily flows swung from -$261.4 million on Wednesday to +$5.1 million on Thursday. Total assets across the funds are near $104 billion.
Glassnode says more than 70% of Bitcoin supply is in profit. Long-term-holder realized losses are down about 85% from the August peak.
Holders who bought six to 12 months ago have an average cost basis near $88,000. Rallies toward that level could bring selling at break-even.
Analyst Ali Charts posted that Bitcoin has had mixed results in the month after U.S. midterm elections. It gained 30.91% in 2010 and 6.61% in 2014, then fell 47.13% in 2018 and 18.15% in 2022. With the next vote on Nov. 3, 2026, he points to volatility.
BITCOIN POST U.S. MIDTERM ELECTIONS
Bitcoin’s performance in the month following U.S. midterm elections has been mixed:
• 2010: +30.91%
• 2014: +6.61%
• 2018: -47.13%
• 2022: -18.15%Interestingly, the pattern shifted after 2014, with $BTC delivering negative returns… https://t.co/u7pxFLuxYH pic.twitter.com/mX2ATToNqR
— Ali Charts (@alicharts) October 18, 2026
Bitcoin gained about 1.9% Monday as oil prices and U.S. Treasury yields fell, Reuters reported. Oil dropped after a U.S. move to waive some sanctions and tariffs on Russia.
Markets are watching the Fed’s Oct. 28 policy decision, as hotter inflation data keeps another rate increase possible.
Strategy, the largest corporate BTC holder, could be removed from MSCI global indexes under revised rules. Passive funds could sell about $2.8 billion of its shares, Reuters reported.



Be the first to comment