



XRP is testing $1.22-$1.34 weekly support, while $1.50-$1.70 must be reclaimed before resistance at $2.09 and $2.32 comes into focus.
XRP is sitting directly on a weekly support zone that could determine whether the recovery from its August low remains intact.
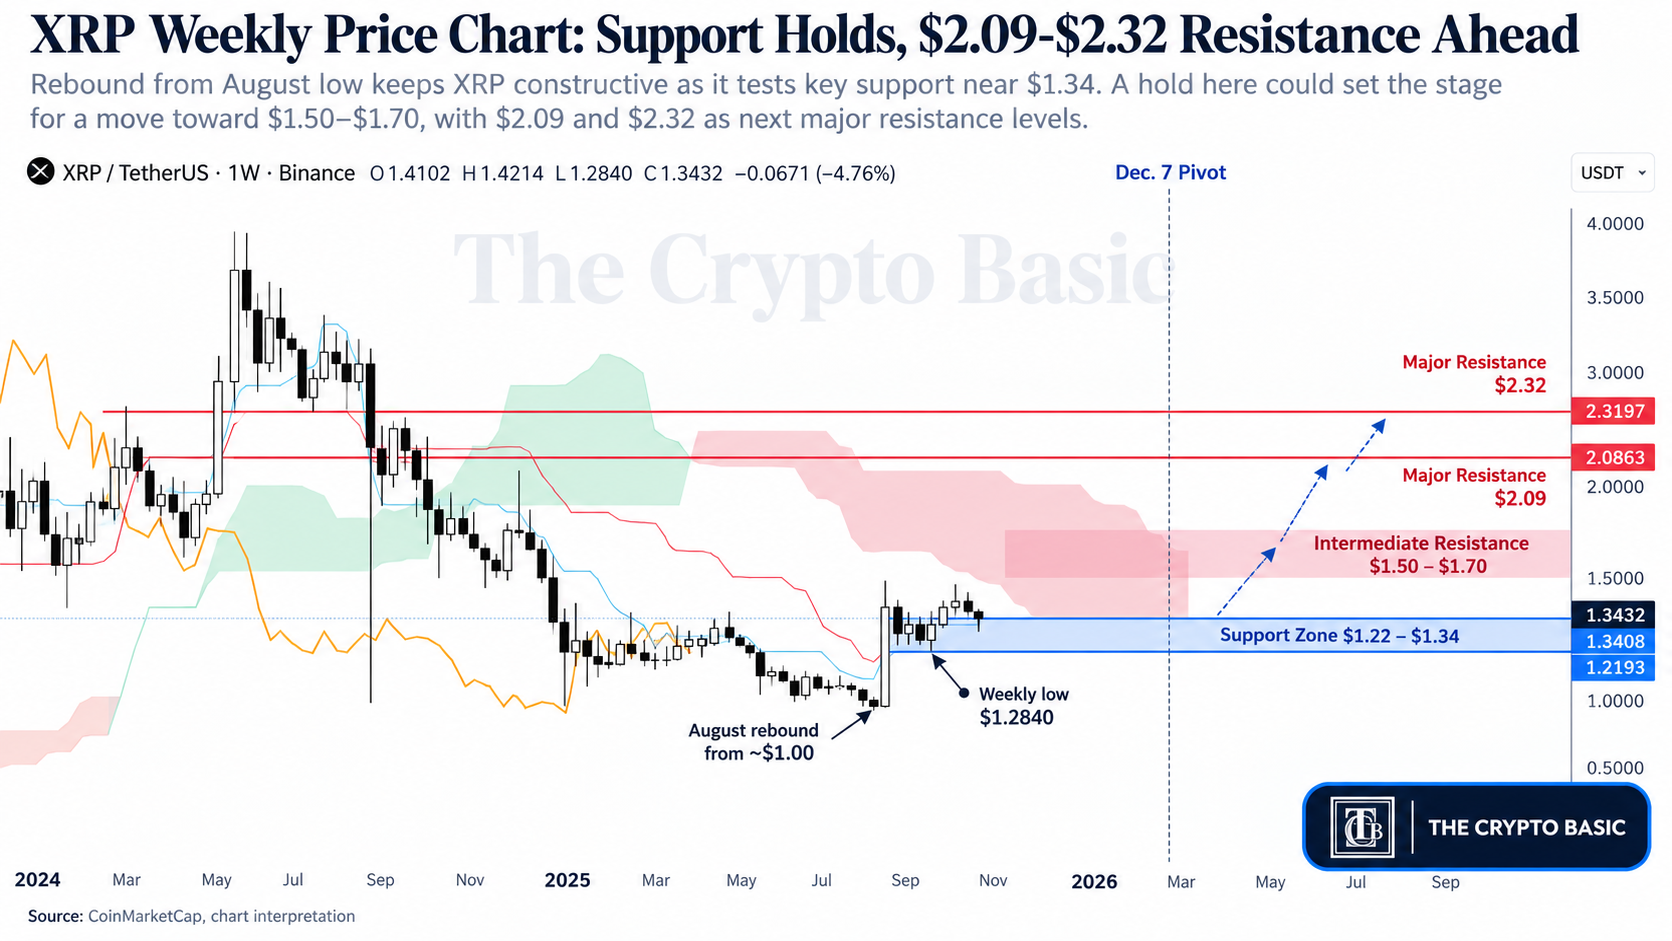
The chart places support between roughly $1.22 and $1.34, while the larger upside structure points to major resistance at $2.09 and $2.32 if buyers can first reclaim the recent $1.50-$1.70 range.
XRP currently trades around $1.34, according to CoinMarketCap, almost exactly where the chart places the upper boundary of support at $1.3408.

The current weekly candle has already traded as low as $1.2840 before recovering toward $1.34. That means price has entered the support zone rather than merely approaching it.
XRP Is Testing $1.22-$1.34 Support
The blue zone is the immediate technical battleground.
Its upper boundary sits at $1.3408, while the lower boundary is marked near $1.2193. XRP’s dip to $1.2840 placed price well inside that range, but buyers have so far prevented a move toward its lower edge.
That matters because the current recovery began after XRP fell toward approximately $1.00 in August, where the chart marks the beginning of a new cycle phase.
From that low, XRP rebounded strongly and eventually traded near $1.70 before momentum weakened again.
The latest pullback is therefore testing whether that August recovery can establish a higher low. Losing $1.2193 on a sustained weekly basis would weaken that case considerably and bring the August base back into greater focus.
$1.50-$1.70 Must Fall Before the Bigger Targets Matter
Even if XRP holds the current support zone, the path higher is not clear.
Recent weekly price action shows substantial congestion between approximately $1.50 and $1.70. This area contains several previous highs and would be the first major hurdle in any recovery.
From the current $1.34 area, a return to $1.50 would require roughly 12% upside, while $1.70 would require about 27%.
Reclaiming that range would provide much stronger evidence that the August rebound is resuming.
XRP Still Trades Below the Weekly Ichimoku Cloud
The larger challenge sits above those recent highs.
XRP remains below the projected weekly Ichimoku cloud, which extends across the months ahead and represents an overhead resistance area in the current setup.
The cloud gradually descends as it moves toward 2027, meaning XRP would need to regain both horizontal resistance and the broader Ichimoku structure before the weekly trend could look materially stronger.
Holding near the current support and short-term Ichimoku levels may stabilize price, but it does not by itself confirm a bullish reversal.
$2.09 and $2.32 Are the Major Recovery Levels
The chart marks two clearly defined higher resistance levels at $2.0863 and $2.3197.
At the current price, reaching $2.09 would require an advance of roughly 56%. A move to $2.32 would represent approximately 73% upside.
These levels should be treated sequentially.
A sustained break through $2.0863 would make the upper $2.3197 resistance more relevant. Until XRP first clears $1.50-$1.70 and works back through the weekly cloud, however, both remain higher-timeframe recovery hurdles rather than immediate targets.
December Marks the Next Cycle Checkpoint
The chart’s next vertical timing marker falls in the week beginning Dec. 7, 2026.
That date should not be treated as a deadline for XRP to reach $2.09 or $2.32. Instead, it provides a point at which the weekly structure can be reassessed: whether XRP has held its support, reclaimed intermediate resistance, or fallen back toward the August lows.
For now, the chart leaves XRP at the first stage of that roadmap. The $1.22-$1.34 zone needs to hold before the $1.50-$1.70 recovery range—and eventually $2.09-$2.32—can come back into play.



Be the first to comment