



Hyperliquid’s HYPE is trading near $78.2 after bulls failed to hold a push above $80 on Monday, keeping the token roughly 20% below its September high near $98.
Key Takeaways
- HYPE trades near $78.2, about 20% below its September peak near $98.
- Resistance stacks near $86-$87, where the 50-day SMA meets the 0.236 Fib.
- Support stacks near $74.5, where the 100-day SMA meets the 0.5 Fib.
Sellers defend the $80 line
HYPE nearly doubled between late July and late September, running from around $51 to $98. The pullback since then has dragged it back between two key Fibonacci levels from that rally: the 0.382 near $80 and the 0.5 near $74.5.
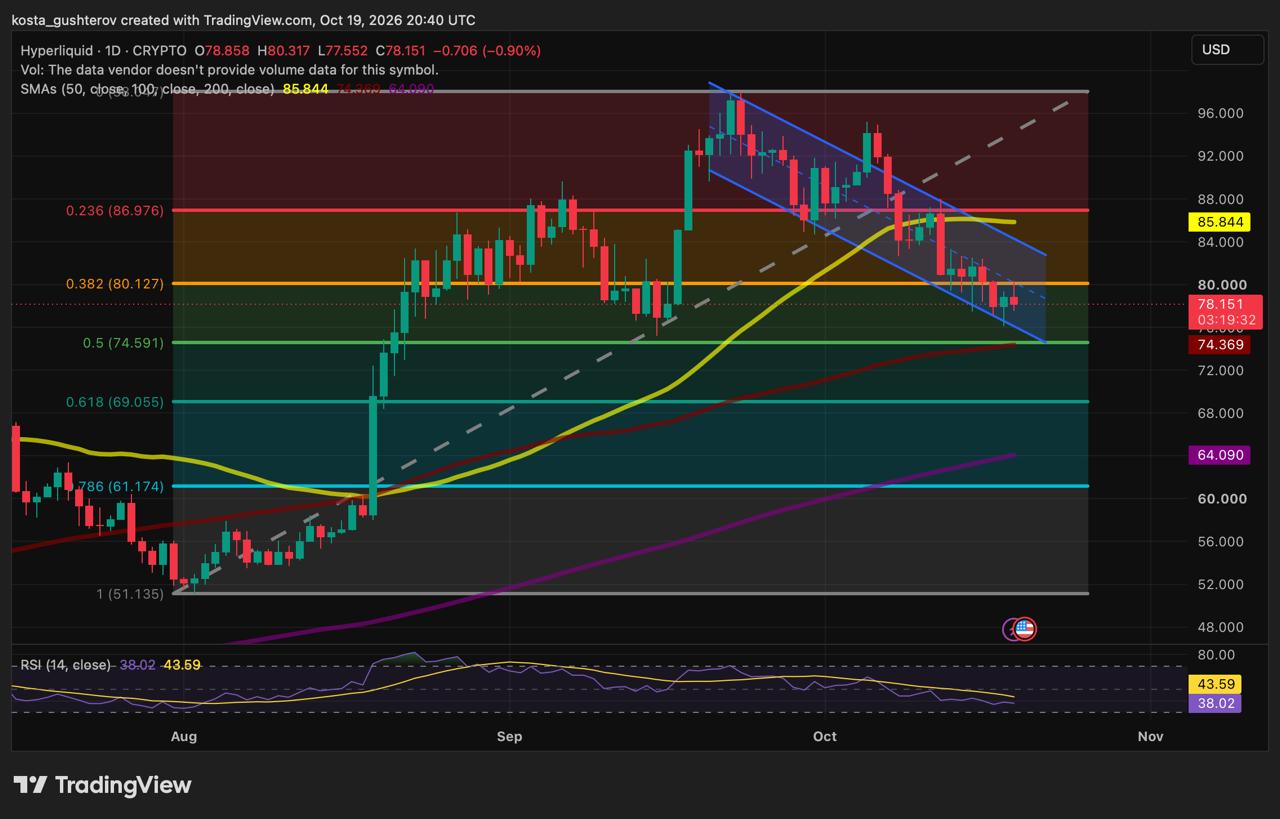
Each bounce along the way has topped out lower than the last, carving out a falling channel. An early-October pop toward $95 briefly broke above it, but sellers stepped in fast and the slide picked up again.
The $80 level has now flipped. It acted as support through mid-October, gave way, and on Monday it capped another bounce. HYPE wicked to about $80.3 before slipping back toward $78.
Heavy resistance overhead
Any recovery runs straight into a crowded zone near $86-$87. The 50-day SMA has flattened around $86 after climbing through September, and it sits right under the 0.236 Fibonacci level near $87.
With two major levels stacked that close together, this band is the toughest hurdle on the chart. It sits roughly 10% above the current price, and bulls would need to clear $80 first just to get there.
Strong support below
The floor looks just as solid. The 100-day SMA, rising toward $74.5, has almost merged with the 0.5 Fibonacci level, and the lower edge of the falling channel is heading into the same area.
That gives buyers a clear spot to step in. A hold there would keep the whole move a clean half-retracement of the summer rally, and the bigger trend still backs that case. The 100- and 200-day averages are climbing, the 50-day remains above both, and HYPE trades over 20% above its 200-day SMA near $64.
Momentum is the weak spot. RSI sits near 38, below its signal line and under the 50 midpoint, though it has not yet reached oversold territory.
Potential Moves (not a forecast)
HYPE is boxed in between resistance near $80 and strong support near $74.5.
Upside: A daily close back above $80 could send price toward the $86-$87 zone, where the 50-day SMA and 0.236 Fib meet. A break through that band would also clear the falling channel.
Rejection: Another failure at $80 could bring the $74.5 support zone into play. Losing it on a daily close could open the way to the 0.618 Fib near $69.
Bigger picture: As long as the 100- and 200-day SMAs keep rising, a dip toward $74.5 still fits a pullback inside a broader uptrend. A drop below $69 would put the 200-day SMA near $64 in focus.
| Level | Price | Role |
|---|---|---|
| 0.236 Fib + 50-day SMA | $86-$87 | Strong resistance |
| 0.382 Fib | Near $80 | Former support, now resistance |
| 0.5 Fib + 100-day SMA | Near $74.5 | Strong support |
| 0.618 Fib | Near $69 | Next support |
| 200-day SMA | Near $64 | Long-term trend |
For now, $80 is the level bulls need back. A daily close above it in the coming days would put the $86-$87 zone on the radar, while a close below $74.5 before the end of October would hand sellers control of the bigger picture.
This article is provided for informational purposes only and does not constitute financial advice. Cryptocurrency prices are volatile.

Kosta has reported on cryptocurrency markets and blockchain infrastructure since 2020, bringing over six years of hands-on experience in the crypto industry built through daily tracking of markets, trends, and emerging blockchain developments. Specializing in Bitcoin on-chain analysis, institutional ETF flows, and digital asset price action, his work at Coindoo has been cited by other news agencies and consistently covers market developments with a focus on data-driven reporting across Bitcoin, Ethereum, Solana, and XRP.
Over the years, Kosta has contributed to multiple crypto media outlets in different regions, authoring over 6,000 articles across the sector. His reporting spans cryptocurrency markets and the broader fintech industry, tracking not only price action but also the technological and regulatory forces shaping the ecosystem.
To support his analysis, Kosta actively leverages on-chain data and metrics from leading platforms such as Santiment, Glassnode, and CryptoQuant, enabling deeper, evidence-based market insights. He believes in the power of transparency and the data that underpins the blockchain ecosystem.
His academic background in Marketing Management from Denmark further complements his analytical approach, adding a strong understanding of communication strategy and content positioning to his work.



Be the first to comment