


What to know:
- TRUMP shows early bullish reversal signals with an inverse head-and-shoulders pattern forming.
- Resistance levels at $3.20 and $3.36 are key for any upside breakout confirmation.
- The MACD bullish crossover indicates weakening bearish pressure but no full trend reversal yet.
OFFICIAL TRUMP (TRUMP) is showing early signs of a potential recovery as traders monitor a developing inverse head-and-shoulders pattern on lower timeframes.
According to the crypto analyst Shiefrat, if confirmed, this classic bullish reversal structure could indicate shifting momentum from sellers to buyers, with attention building around a possible breakout that may signal renewed short-term strength.

Source: Chiefrat’s X Post

Key upside targets are $3.20 and $3.36, where resistance is expected if bullish momentum continues. However, confirmation remains essential, as broader crypto sentiment is still mixed.
A breakout above the neckline with strong volume will be needed to validate the setup; otherwise, the pattern may fail and price could resume downside pressure.
Also Read: TRUMP MACD Bullish Crossover Hints at Short-Term Rally Toward $4.30
TRUMP Technical Outlook Points to Cautious Optimism
According to TradingView, TRUMP sees a strong rise in mid-March, reaching a peak at around $4.80, after which it declines gradually.
The token is currently trading below the EMA cluster, which acts as strong resistance. The nearest point of resistance for a rise in the asset is the 20 EMA, currently at $2.98, which is a bearish scenario.
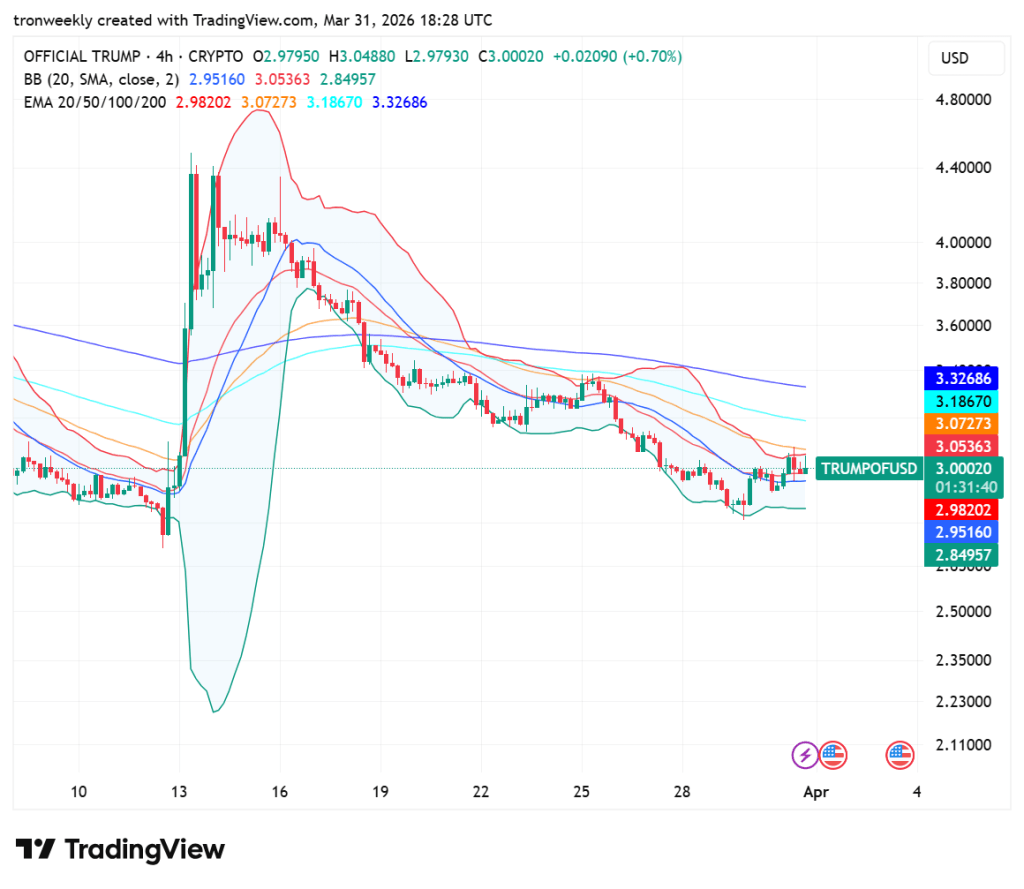
Source: TradingView
The asset’s volatility has decreased considerably with the tightening of the Bollinger Bands around the $3.00 price level. The price is resting on the 20-day simple moving average, sandwiched between the support level of $2.84 and the resistance level of $3.05.
This is the consolidation phase, which indicates indecision in the market. A high-volume breakout is required to change the direction of the asset’s long-term downtrend.
Momentum Indicators Show Easing Downward Pressure
The Relative Strength Index is at 53.04, indicating a neutral trading pace with a slight inclination towards the buying side.
As the RSI touches the oversold region on March 29, the line begins to rise, crossing the signal line at 42.82. This is an indication that buying is picking up again. The RSI is still far from the 70-level overbought region.

Source: TradingView
A change in mood is indicated by the MACD indicator. It shows a bullish crossover as the blue line crosses above the orange line. It is accompanied by the histogram turning green to indicate the fading of the downward momentum.
Even though the lines remain low, the widening distance indicates the strengthening of the recovery. Leveling off at 3.03 indicates that the bulls are back in control.
This article contains market analysis and price predictions. These are not guarantees. Crypto markets are volatile. Always DYOR. Not financial advice.
Also Read: Trump Memecoin (TRUMP) Surges Ahead of Mar-a-Lago Luncheon Event

Be the first to comment