


Bitcoin has climbed back above $82,000 as a recovery in technology stocks lifted market sentiment, although traders remain divided over whether BTC can break through $85,000.
Summary
- Bitcoin recovered above $82,000 on October 21 but remained below resistance around $83,100 and $85,000.
- SoSoValue data show $23.16 million in October 20 inflows.
- Crypto Rover identified more than $2 billion in potential short-liquidation liquidity between $84,000 and $85,000.
- Rekt Capital warned that Bitcoin’s weekly close below $82,200 could lead to further selling.
- Daily Bollinger Bands and MACD readings indicate that buyers have yet to establish a sustained recovery.
According to crypto.news market data, the cryptocurrency traded around $82,500 at the time of writing, gaining 1.24% over 24 hours while remaining 1.30% lower for the week.

The recovery followed stronger corporate results and forecasts from major technology companies, including SpaceX and Super Micro Computer. Asian equities advanced Wednesday, with semiconductor-related stocks benefiting from renewed interest in artificial intelligence investments.
Despite the improvement, BTC has struggled to sustain trading above $83,000. The cryptocurrency’s rejection near $88,000 and subsequent retreat below its 20-day moving average have left several resistance levels between its current price and a stronger recovery.
Bitcoin ETF inflows lose momentum after Monday’s rebound
U.S. spot Bitcoin ETFs recorded $526.60 million in net inflows on October 19, their strongest session since September 22.
BlackRock’s iShares Bitcoin Trust accounted for $665.2 million in inflows that day. Fidelity’s FBTC and Grayscale’s GBTC experienced withdrawals of $83.6 million and $54.9 million, respectively, partly offsetting BlackRock’s gains.
On October 20, Bitcoin ETF inflows fell to $23.16 million, bringing cumulative net inflows to $57.43 billion, according to SoSoValue. Total net assets rose from $105.46 billion to $106.28 billion, while daily trading volume declined from $2.09 billion to $1.92 billion.
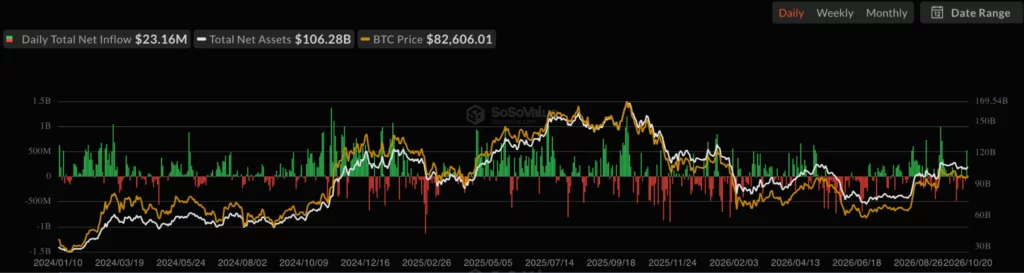
October has already produced substantial changes in ETF demand. During October 12–16, Bitcoin investment funds lost $228.4 million, according to weekly cryptocurrency ETF data.
Separate research from Bitfinex found that BTC futures open interest grew 4.3% between October 12 and 15 despite declining prices. As crypto.news reported on October 19, analysts warned that rising leverage during periods of weak spot demand could leave the market vulnerable to liquidations.
Analysts identify $84,000–$85,000 as the next BTC price hurdle
Crypto Rover identified a concentration of potential short-liquidation liquidity between $84,000 and $85,000 in an October 21 market commentary.
According to the analyst, more than $2 billion in short-liquidation liquidity was positioned within the range. The estimate has not been independently confirmed against an underlying liquidation heatmap.
Such estimates represent potential liquidation levels based on derivatives positioning and modeling. They do not establish that $2 billion of contracts will necessarily be liquidated if Bitcoin reaches those prices.
Rover separately suggested that a golden cross could develop on BTC’s chart. The analyst pointed to historical bullish reactions following the indicator, although the post did not specify the moving averages involved or confirm that the crossover had occurred.
Rekt Capital presented a more cautious assessment, identifying BTC’s weekly close below approximately $82,200 as a potential bearish signal.
The analyst argued that a failed attempt to reclaim $82,200 could turn the area into resistance and lead to another decline within BTC’s weekly trading range.
With BTC moving around $82,500, the market is trading close to the level Rekt Capital identified. Whether the price holds above it on subsequent closes remains relevant to that assessment.
Crypto Lens outlined two speculative price paths involving $75,000, $67,000 and $105,000. Neither represents a confirmed forecast, and the analyst did not establish a timetable for those levels in the supplied commentary.
The immediate resistance area was examined in an October 20 Bitcoin market update, which identified $84,200 as a level traders were watching for a possible recovery from the local bearish structure.
Bitcoin price analysis points to resistance at $83,101
The daily technical readings place Bitcoin near $82,500, below the 20-day simple moving average following a rejection around $88,000.
Bollinger Bands show the middle line at $83,100, the upper band at $86,130 and the lower band at $80,100. The figures establish a relatively narrow distance between Bitcoin’s current trading price and the central resistance level.
A daily close above $83,101 would put BTC back above the middle Bollinger Band. The next resistance levels identified by the chart are $86,126 and the $88,000 zone.
Conversely, renewed selling below $80,076 would bring $78,000 and $76,000 into focus as potential downside levels. Those targets are technical scenarios, not observed trading prices.
The Moving Average Convergence Divergence indicator provides another cautious signal. The MACD line stands at 52, compared with a signal line of 268, producing a negative histogram reading of -216.
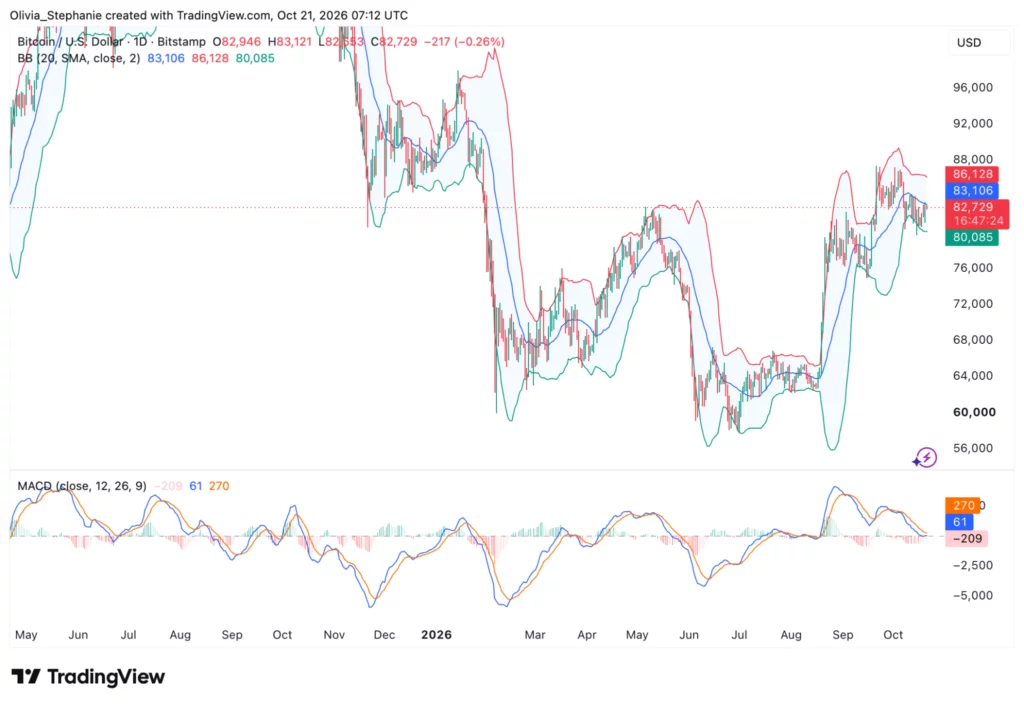
Although both MACD lines remain above zero, the negative histogram indicates that momentum has weakened relative to the signal line.
The readings support a mixed technical picture: BTC has recovered some of its recent losses, but the price remains below its central Bollinger Band and previously tested resistance levels.
In a separate macroeconomic assessment supplied for this report, CryptoQuant market commentator nocoffeenobrain compared current bond-yield and equity conditions with episodes in 2018 and 2025, when Bitcoin and U.S. equities experienced selling pressure.
The commentator cautioned that the historical periods involved different economic catalysts and did not establish that the same price developments would occur again.
On October 21, Reuters reported that U.S. Treasury yields remained above 5%, while Asian stocks advanced and financial markets continued assessing corporate earnings, oil prices and borrowing costs.
Disclosure: This article does not represent investment advice. The content and materials featured on this page are for educational purposes only.



Be the first to comment