


What to know:
- Solana (SOL) struggles to surpass key resistance amid weak technicals and market uncertainty.
- Short-term moving averages act as barriers, while RSI and MACD indicate seller dominance.
- Bearish flag pattern forms, signaling potential further decline if resistance holds.

Solana (SOL) is facing pressure from its weak technicals and general market uncertainty. The SOL has not been able to gain traction and is facing difficulties in pushing past resistance levels that were previously support levels. Solana’s technical analysis shows a bearish setup for the coin.
At the time of writing, Solana (SOL) is trading at $81.10, recording a 24-hour trading volume of $7.13 billion and a market capitalization of $46.46 billion. The token has declined by 3.53% over the last 24 hours, reflecting broader weakness across the crypto market.

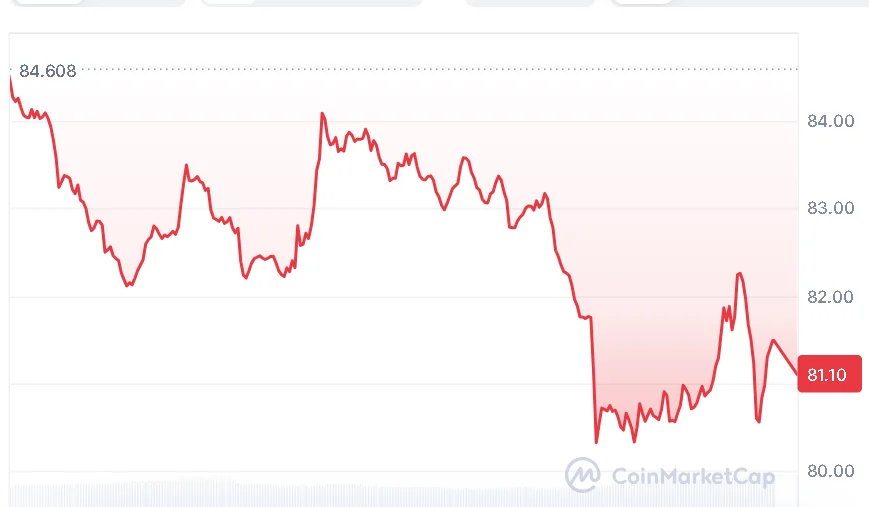
Source: CoinMarketCap

Solana Hits Key Resistance Level
A popular crypto analyst, BATMAN, shared a conservative view of the price action of Solana. The analyst stated that there were no signs of recovery for the SOL token, just like the overall market.
The price has touched a previous support point, which is currently functioning as resistance. This indicates that there might be problems with the short-term price rise. The analysis offered by BATMAN should be taken into consideration by investors.


Source: BATMAN’s X Post
The BATMAN also indicated that the tensions in the Middle East are another factor that is causing uncertainty in the financial market. In such an environment, a bearish flag pattern that is forming on the Solana chart could soon be realized, which could lead to a possible decline in the price of Solana.
Also Read | UAE Fuel Prices Jump 4x in Shocking April Surge
Technical Weakness Weighs on Solana
From a technical perspective, Solana appears to be in a weak position. The price continues to trade below the moving average ribbon, a sign of a declining trend. The short-term MAs, such as the 20-day MA at 87.96 and the 50-day MA at 85.74, act as a barrier above the current trading price. The 100-day MA at 104.42 and the 200-day MA at 139.65 are significantly higher.

Source: TradingView
Momentum indicators suggest caution. The RSI is close to 39.6, below the neutral 50. It indicates that buying pressure remains low even after the recent surge. The MACD remains in negative territory. The line remains at -1.66, while the signal line remains at -0.93. The histogram remains in the negative zone at -0.72, indicating that sellers dominate, but the rate of decline has slowed.
Overall, Solana is at a crucial juncture. A breakout above resistance could set up a rapid recovery, but if the current pullback persists, then the price may face difficulties in the near term.
This article contains market analysis and price predictions. These are not guarantees. Crypto markets are volatile. Always DYOR. Not financial advice.
Also Read | Cardano Price Prediction: Will ADA Reach $0.30 After Holding Support?

Be the first to comment