



Bitcoin price is nearing a key resistance area as sell orders pile up above its current price, prompting questions about whether buyers can keep the recovery going toward $90,000.
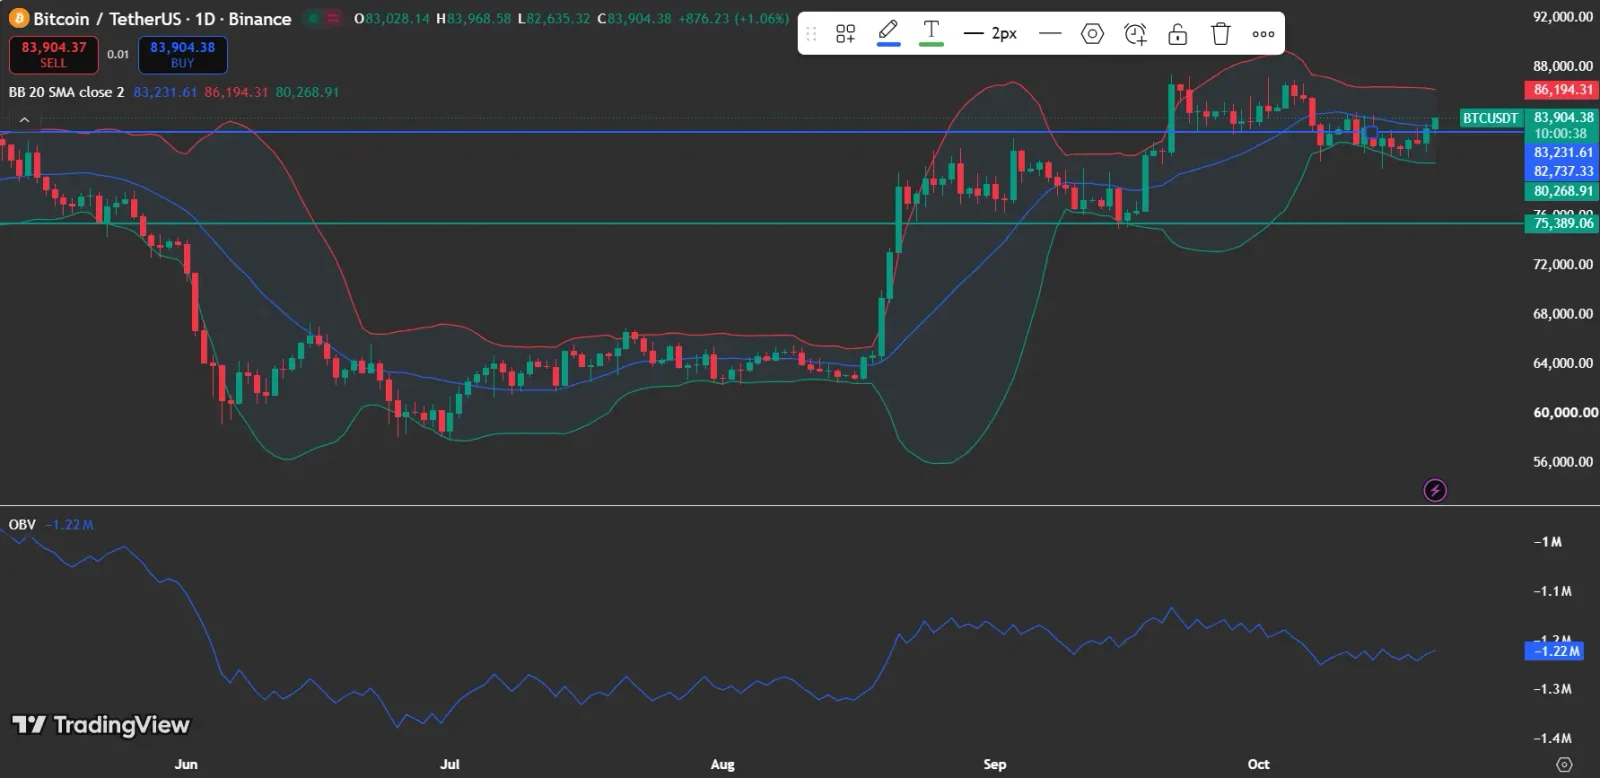
At the time of writing, Bitcoin price is trading at $83,904.38, up 1.06% on the displayed TradingView daily candle.
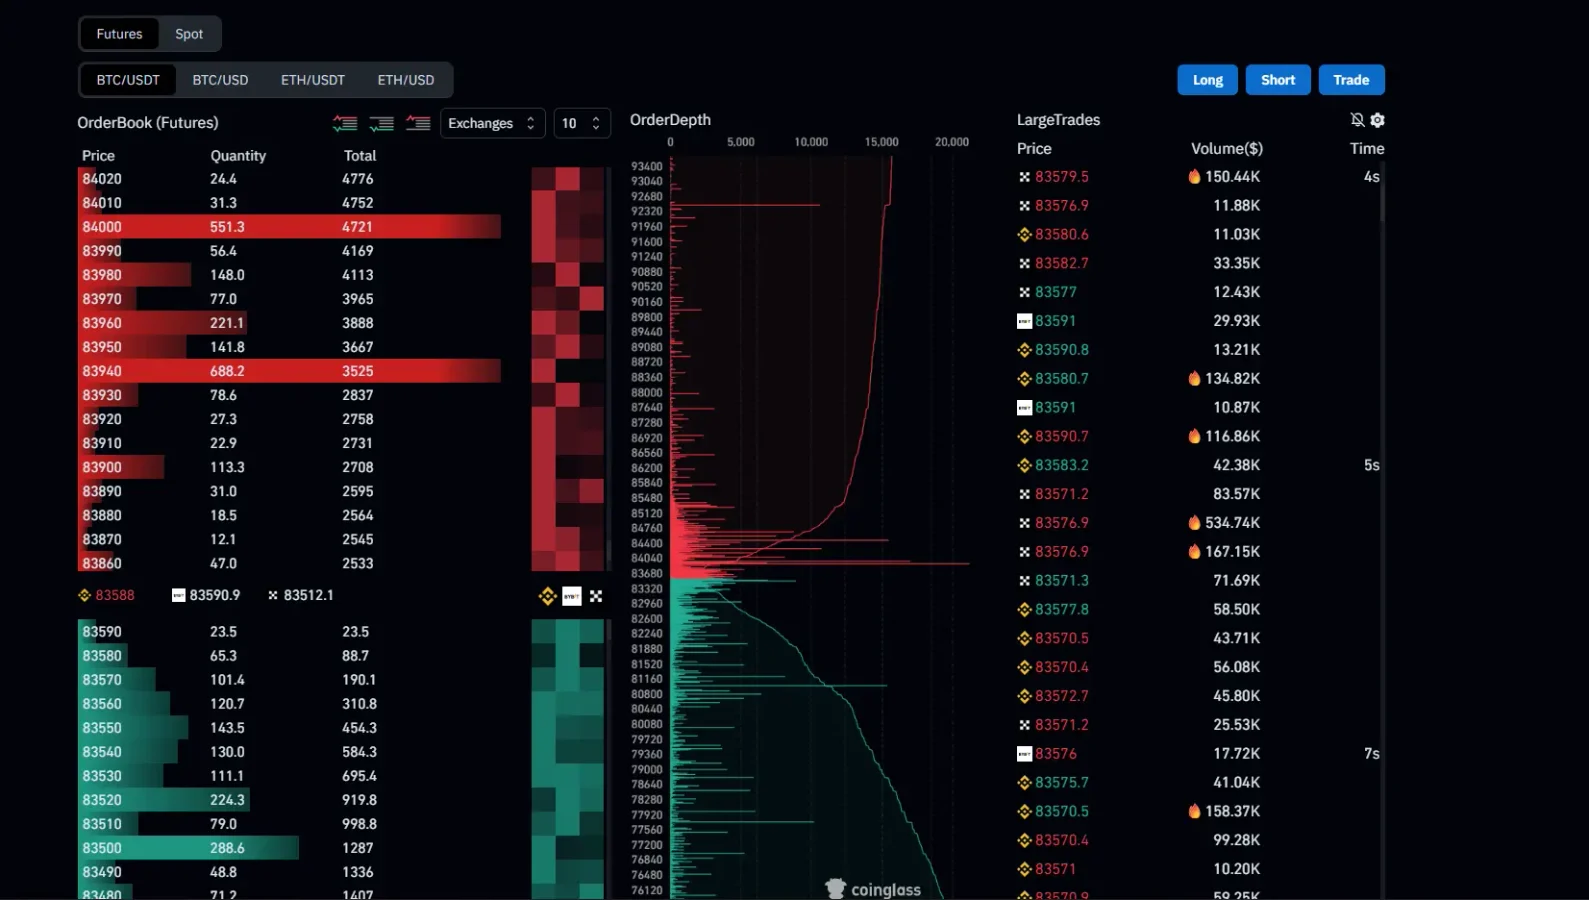
Ted Pillows has pinpointed a cluster of sell orders between $83,500 and $85,000, indicating that Bitcoin may need stronger buying pressure to absorb the overhead supply.
Also Read: Bitcoin Price Outlook: Strive’s BTC Accumulation Could Accelerate Momentum

Why Is BTC Price Meeting Resistance Near $85K?
In his X post, crypto market commentator Ted Pillows said that “A lot of sell orders have been placed between $83,500 and $85,000.” He noted that “$90K could happen very soon” if Bitcoin clears this level.
The sell zone matters because large clusters of limit sell orders can make it harder for buyers to drive the price higher. Even so, displayed orders can be cancelled or changed, so the zone should be seen as potential resistance rather than a guaranteed barrier.
Also Read: Bitcoin Price at Crossroads: $84.2K Breakout or $80K Drop?
What Does the CoinGlass Order Book Show for BTC Price?
The CoinGlass futures order book offers a closer look at selling liquidity near Bitcoin’s current price. The provided screenshot shows 688.2 BTC in sell orders at $83,940 and another 551.3 BTC at $84,000.
These clusters could create near-term hurdles as BTC approaches $84,000. The same screenshot shows buy orders of 288.6 BTC at $83,500 and 224.3 BTC at $83,520, giving a view of nearby buying liquidity. These bids do not guarantee support, and the order book can change quickly.
What Does the BTC Price Chart Show?
On TradingView’s daily chart, Bitcoin is trading above the middle Bollinger Band, which sits at $83,231.61. The upper band is positioned at $86,194.31, whereas the lower band is located at $80,268.91.
Remaining above the middle band would support the near-term recovery, although it does not confirm a breakout above the sell zone. The on-balance volume (OBV) reading is roughly -1.22 million, but the negative reading alone does not establish bearish momentum.
Its recent direction and any sustained increase or decrease would provide more useful context about buying and selling pressure. The chart provided does not show that buying pressure is sufficient to break through the sell zone.
Also Read: Bitcoin Price in Focus as On-Chain Activity and Technical Signals Converge
Is It Possible for BTC Price to Hit $90K?
According to CoinGlass data on the supplied chart, Bitcoin’s open interest is close to $53 billion, with a modest rise toward the end of the period shown. Open interest tracks outstanding derivatives contracts, yet a rise in it alone cannot show whether traders are mostly bullish or bearish.
The volume chart likewise displays uneven activity, and the screenshot offers no clear sign that buying volume is steadily picking up.
A sustained push above $85,000, accompanied by stronger buying activity, would strengthen the breakout case.
Spot-market volume would be particularly useful for assessing whether the move is supported by actual spot demand rather than leveraged futures positioning alone.
Which Levels Should BTC Price Traders Monitor Next?
Should Bitcoin break and hold above $85,000, traders may focus on the area around $86,200 before weighing the possible move toward $90,000 that Ted Pillows highlighted.
Alternatively, a rejection near $84,000–$85,000 could shift attention to the middle Bollinger Band around $83,231, and then to the lower band near $80,269 if selling pressure builds.
At present, the order book pinpoints the immediate obstacle, while the price chart supplies the technical backdrop. A sustained move above $85,000 would strengthen the bullish scenario, while a rejection could leave BTC testing nearby support levels.
The displayed sell orders alone cannot determine which outcome will occur. Cryptocurrency markets stay volatile, so traders should keep an eye on price action, market sentiment, and derivatives conditions before making any investment decisions.
Also Read: Bitcoin Price Analysis: Ali Charts Spots TD Sequential Buy Signal Near $82K
This article contains market analysis and price predictions. These are not guarantees. Crypto markets are volatile. Always DYOR. Not financial advice.



Be the first to comment