



Solana price is trying to bounce back from its recent drop, but a large whale transfer to crypto exchanges has cast doubt on whether the rebound can last.
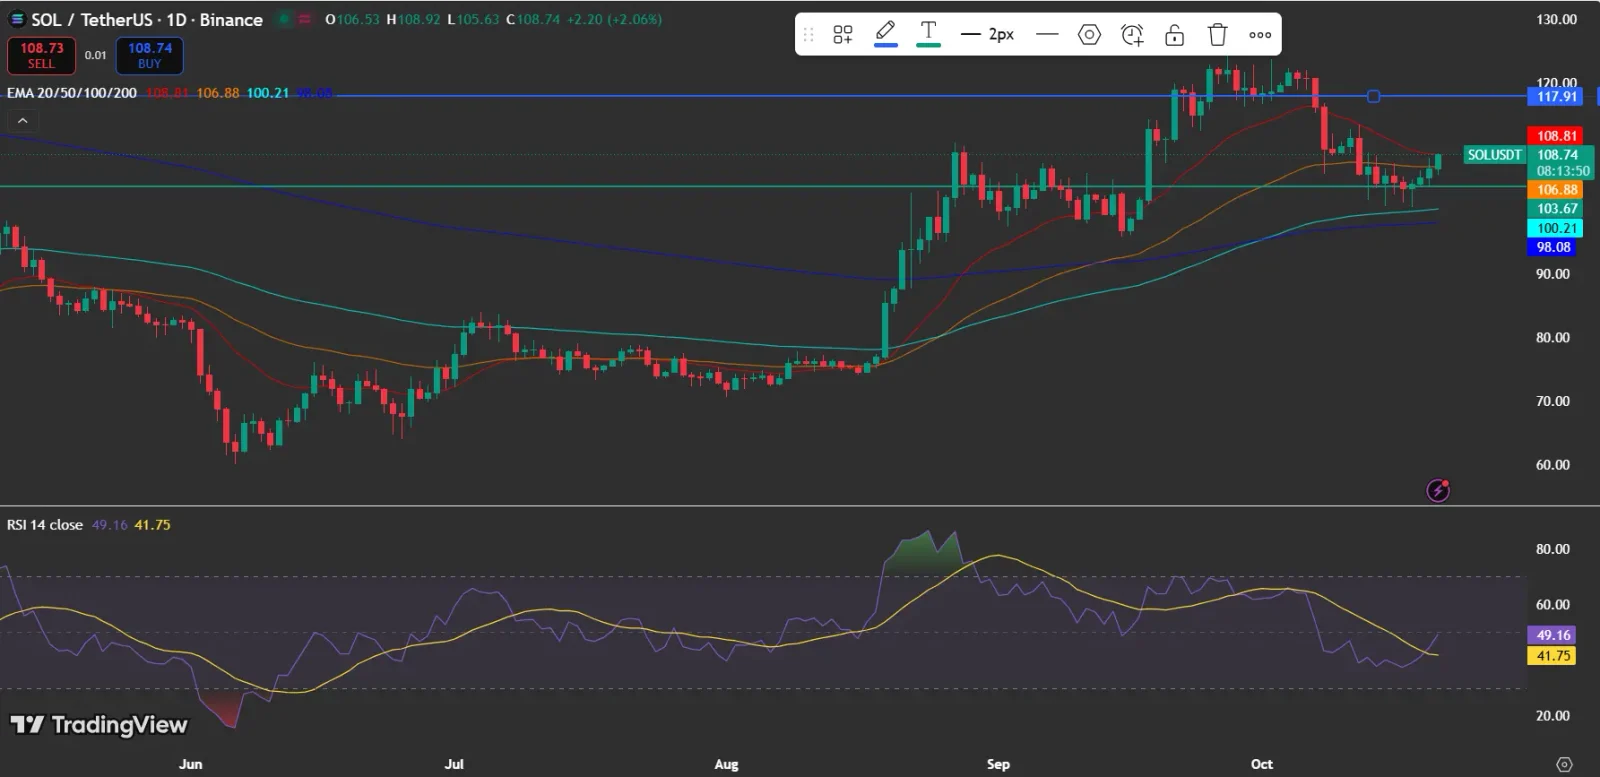
As of press time, Solana price is trading at $108.74, up 2.06%, based on the TradingView chart provided. The rebound comes after Lookonchain reported that a whale deposited 240,000 SOL, worth roughly $25.3 million, into Binance, OKX, and Bybit over the last 24 hours.
These transfers could add selling pressure if the tokens are sold, though exchange deposits on their own do not prove a sale has occurred.
Traders are also monitoring technical indicators and derivatives positioning to judge whether SOL can sustain its recovery.

Also Read: USDC Solana Mint Surges 750M With Strong 68.26B Growth
Why Is Solana Price Under Selling Pressure?
Lookonchain flagged the whale’s activity in a post on X, reporting deposits to three major cryptocurrency exchanges. The account reported that the whale deposited 240,000 SOL over the previous 24 hours, highlighting a potential source of selling pressure.
Large transfers can draw market attention because traders may read them as possible preparations to sell.
The real impact hinges on what happens to the deposited tokens. If the whale sells a significant portion of the holdings, the added supply could weigh on SOL, especially if buying demand stays weak. If the tokens stay on exchanges without being sold, the immediate price impact could be limited.
The transfer thus represents a possible source of selling pressure rather than confirmation of a bearish outcome.
Also Read: Solana Posts $299M App Revenue as SOL Price Outlook Draws Attention
What Does the TradingView Chart Show About Solana Price?
The daily TradingView chart puts SOL at $108.74, just below its 20-day exponential moving average (EMA) of $108.81. This short-term average could serve as an immediate hurdle as buyers try to extend the recovery.
SOL is still trading above its 50-day EMA of $106.88, its 100-day EMA of $100.21, and its 200-day EMA of $98.08. This setup indicates that the recent pullback has not fully undone the broader recovery shown on the chart.
The relative strength index (RSI) is at 49.16, edging nearer to the neutral 50 level. Its recovery suggests that bearish momentum has eased, but the RSI remains just below 50 and has not yet confirmed a stronger bullish shift.
Could Solana Price Climb Above $117?
The chart marks resistance around $117.91, a level SOL would need to retake to reinforce its recovery. To get there, buyers must first drive the price past the 20-day EMA and defend the $106.88 area, where the 50-day EMA currently stands.
To the downside, $103.67 is a nearby level worth watching, with the 100-day EMA at $100.21 next. A sustained break below these zones could undermine the recovery and leave SOL open to further losses.
A move above $108.81 would provide an initial sign of improving short-term strength, while a break above $117.91 would offer stronger confirmation of a recovery. Neither level guarantees that SOL will continue rising.
Also Read: Yuga Labs Mudwater Trading Cards Launches on Solana for BAYC Holders
How Do Open Interest and DeFi Activity Influence Solana Price?
CoinGlass data puts Solana’s open interest at roughly $6.5 billion on the latest chart, under some of the peaks seen in late September and early October. Though open interest is still sizable, the pullback from those highs shows that the total value of outstanding derivatives positions has declined from recent peaks.
Open interest by itself does not show whether traders are mostly bullish or bearish. Shifts in funding rates and liquidation activity would add useful context, but exact current readings were not provided.
In the meantime, the supplied DeFiLlama chart shows Solana’s total value locked at close to $6 billion. TVL has held fairly steady in recent weeks, even as SOL fell back from its September and early October highs.
This suggests that the decline in Solana price has not been accompanied by a comparable drop in the displayed TVL. Still, TVL alone cannot establish whether user activity, capital inflows, or overall network demand has strengthened or weakened.
Also Read: DeFi Development Corp Adds 3,983 SOL as Solana Price Eyes Its Next Breakout
What Should Traders Keep an Eye On Next?
Solana’s near-term direction hinges on whether buyers can reclaim $108.81 and hold the $106.88 zone. A sustained recovery could put the $117.91 resistance level back in play, whereas a break below $103.67 would weaken the short-term outlook.
The whale’s $25.3 million transfer gives traders one more factor to watch, but whether it turns into real market pressure will depend on the selling activity that follows.
Solana price recovery and the whale’s exchange deposits present two competing signals: improving short-term momentum and the possibility of additional supply entering the market.
Crypto markets are still highly volatile, so before making investment decisions, traders should keep an eye on price action, market sentiment, and upcoming catalysts.
Also Read: Solana Leads Stablecoin Transfers as SOL Price Eyes Macro Breakout
This article contains market analysis and price predictions. These are not guarantees. Crypto markets are volatile. Always DYOR. Not financial advice.



Be the first to comment